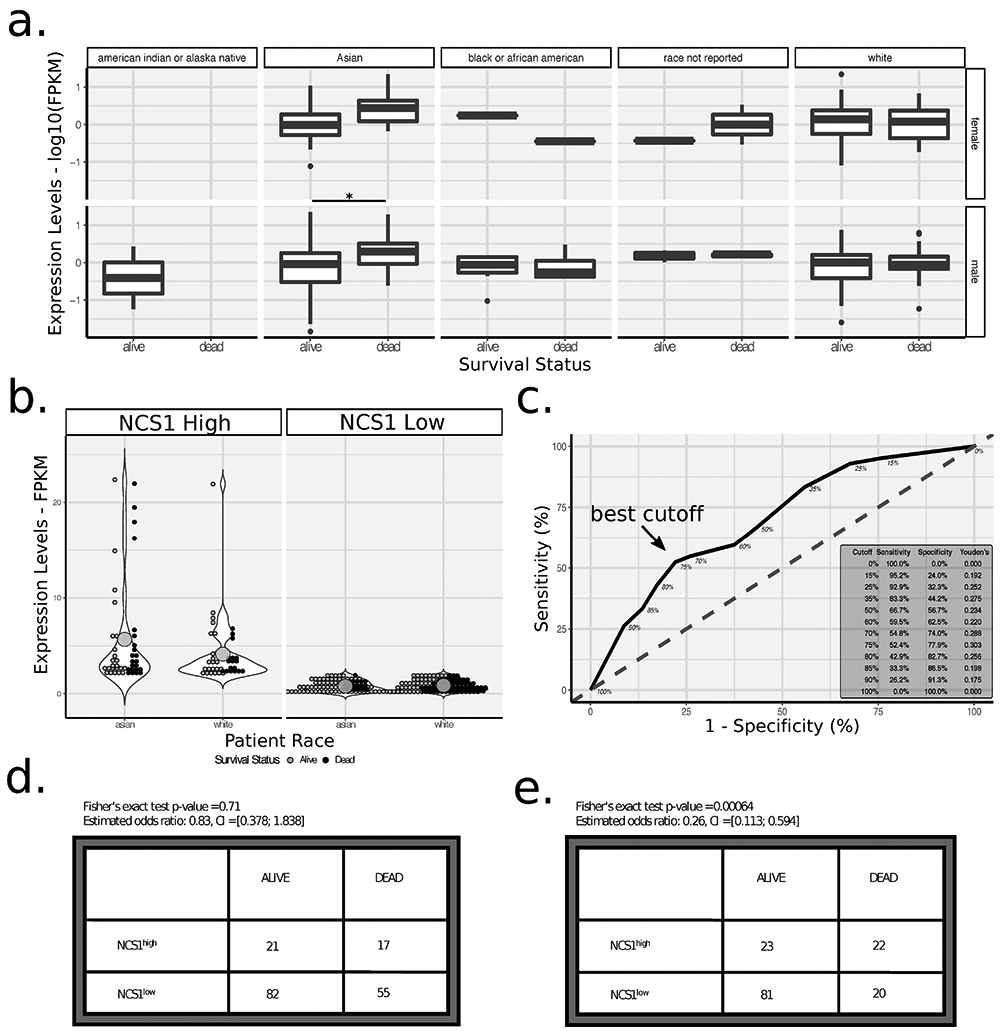
Fig. 2: NCS1 Expression and Patient Survival.

a. Boxplots showing log10-transformed, continuous NCS1 expression levels for male and female patients in rows and different races in columns. Adjacent boxplots partition respective patient populations by survival status. See Supp. Tab. 1 for additional information on sample size. * indicates corrected p-value < 0.05 in a two-sided t-test. b. Dot plots comparing mean (represented by large dots) NCS1 expression levels for NCS1high and NCS1low Asian and white patients. Violin plots visualize overall data distribution. Colors represent survival status of patients. Two-sided t-test p-value = 0.056 for comparison of NCS1 expression levels in Asian vs. white patients (estimated means 2.28 vs. 1.59, respectively). c. Receiver operating characteristic curve showing the optimum cutoff for dichotomizing NCS1 expression in Asian patients to ‘high’ and ‘low’ to be 75% (75% of patients categorized as ‘low’, 25% as ‘high’; indicated by an arrow). Inset in lower right corner lists sensitivity, specificity and Youden’s J statistic for different cutoffs.
d., e. Contingency tables showing NCS1 and survival status for white and Asian patients, respectively. P-values were calculated using Fisher’s exact test, odds ratios and 95% CIs are listed above tables.
