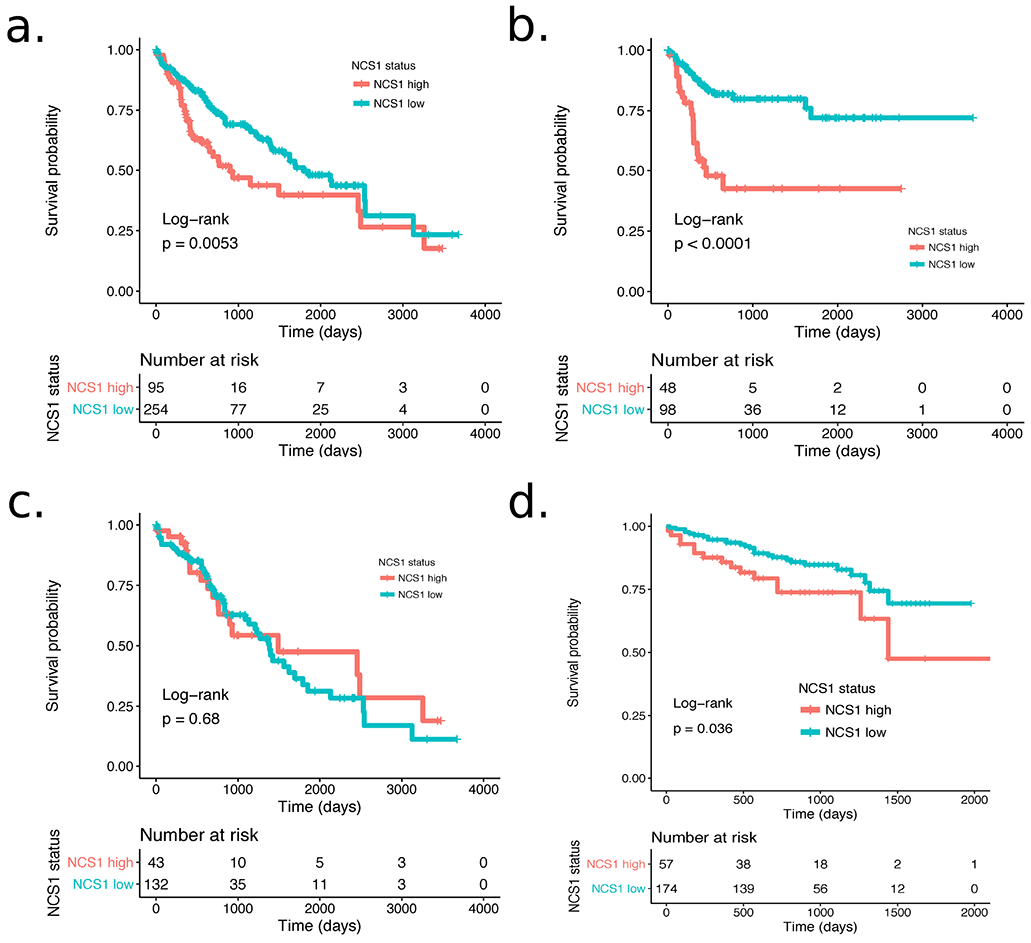
Fig. 3: NCS1 Status and Patient Survival.

a. Kaplan-Meier plot showing survival probability for 349 patients from the TCGA LIHC cohort. Hazard ratio = 1.7 (p = 0.006, 95% CI 1.2 to 2.4). b. Kaplan-Meier plot showing survival probability for n = 146 Asian patients from the TCGA LIHC cohort. Hazard ratio = 3.5 (p < 0.0001, 95% CI 1.9 to 6.5). c. Kaplan-Meier plot showing survival probability for n = 175 white patients from the TCGA LIHC cohort. Hazard ratio = 0.89 (p = 0.68, 95% CI 0.52 to 1.5). d. Kaplan-Meier plot showing survival probability for 231 patients from the ICGC LIRI-JP cohort. Hazard ratio = 1.96 (p = 0.039, 95% CI 1.03 to 3.7).
