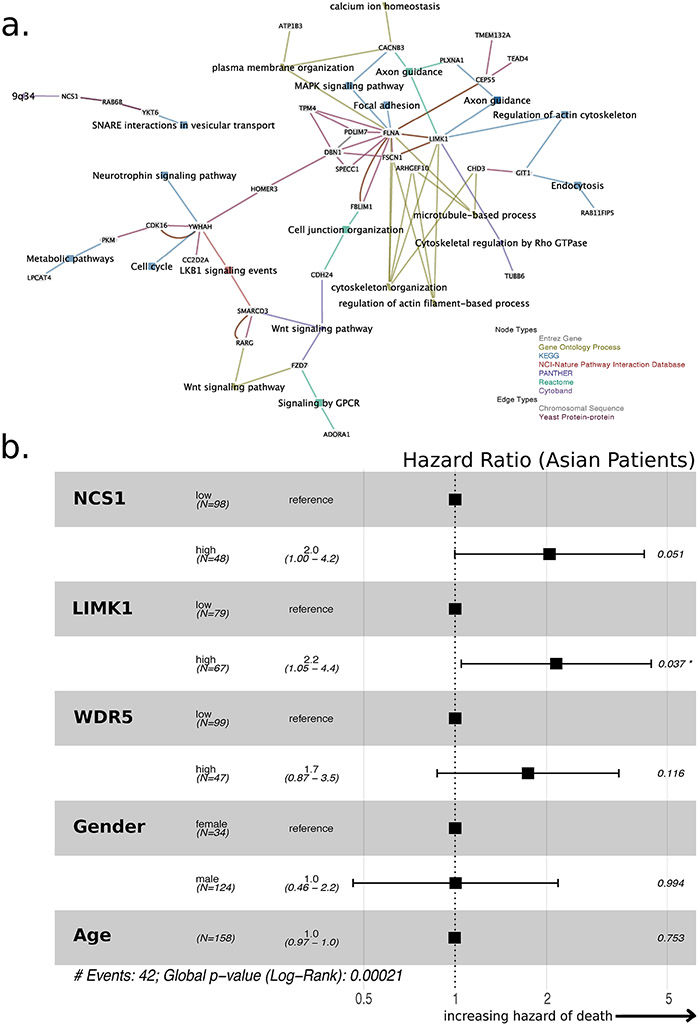
Fig. 4: NCS1 Associated Signaling Pathways in HCC.
a. Co-expression network constructed from 54 NCS1 associated genes using EGAN software. 34 genes are actually part of the network. A legend in the lower right corner explains node and edge types. To not introduce bias, all pathways that comprise at least 2 of the 54 genes are included in the network. b. Forest plot showing hazard ratios derived from a Cox proportional-hazards model that includes dichotomized NCS1, LIMK1 and WDR5 expression, patient age, and gender as covariates to predict survival of Asian TCGA LIHC patients. Dichotomization cutoffs are chosen according to ROC curves. Number of events = 42, p = 0.0002 for all covariates together.

