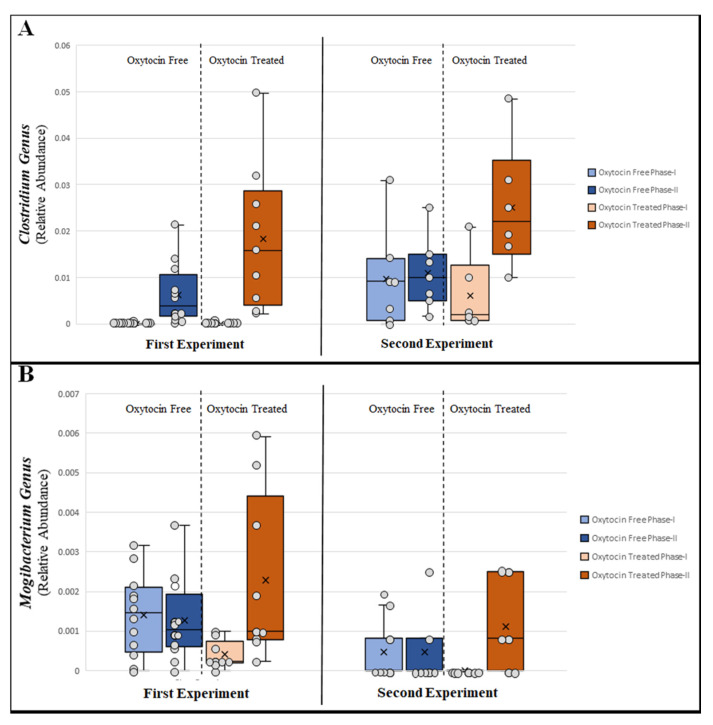
Figure 4.
Bacterial genera significantly differentiating oxytocin-treated and non-treated groups: first experiment, each circle represents a single cage pool; second experiment, each circle represents a single animal; phase I, pre-treatment; phase II, post-treatment; (A) Clostridium; (B) Mogibacterium.

