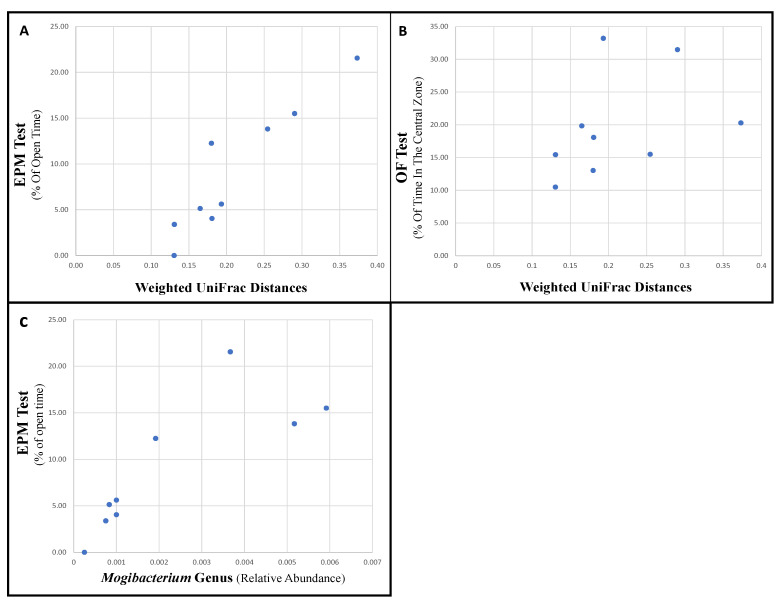
Figure 5.
Correlation of behavioral test scores with microbiota parameters in oxytocin-treated rats. The cage mean behavioral tests score was used. Spearman’s correlation values: (A) weighted UniFrac Distance and EPM test, p = 0.001, R = 0.92; (B) weighted UniFrac Distance and OF test, p = 0.04, R = 0.7; (C) relative abundance of Mogibacterium and EPM, p = 0.001, R = 0.92.

