Figure 2.
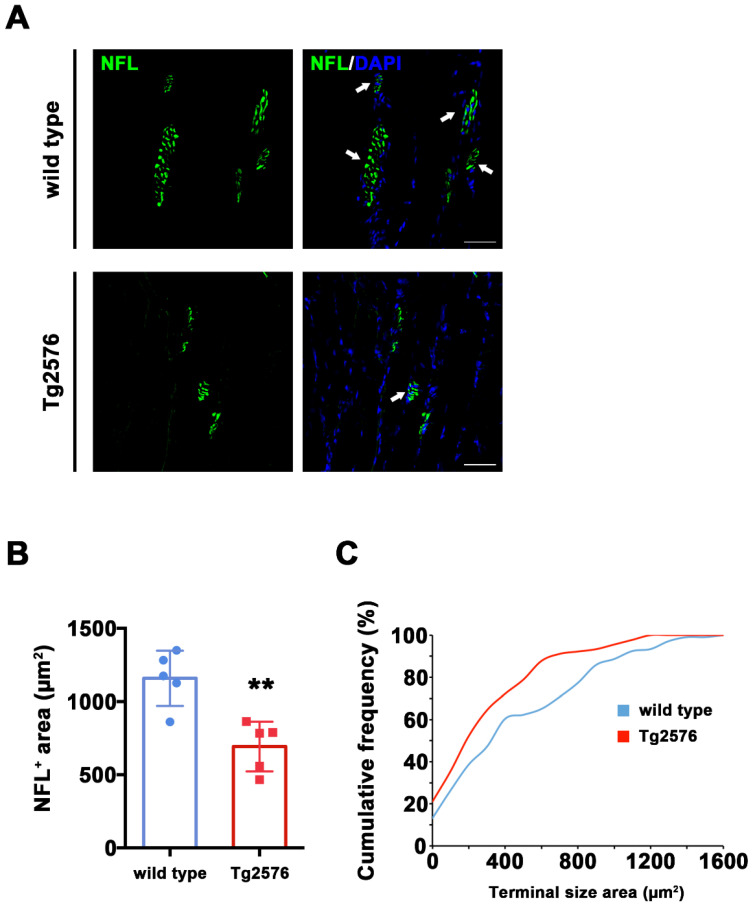
Reduced pre-synaptic area in TA muscle of Tg2576 mice. (A) Representative images of TA sections, stained with antibodies anti-NFL (green) from Tg2576 and wild type mice. Sections were counterstained with DAPI in order to detect cell nuclei. White arrows point to pre-synaptic area. Scale bar = 50 µm. (B) Histogram reporting the average area of NFL signal in pre-synaptic areas from TA sections of Tg2576 and wild type mice (n = 5 mice per genotype). Unpaired t test was used for comparison (** = p < 0.01). (C) Graph of cumulative frequencies reporting the distribution of NFL-positive signal sizes of both genotypes (n = 5 mice per genotype). Kolmogorov–Smirnov test was used for comparisons (p < 0.05).

