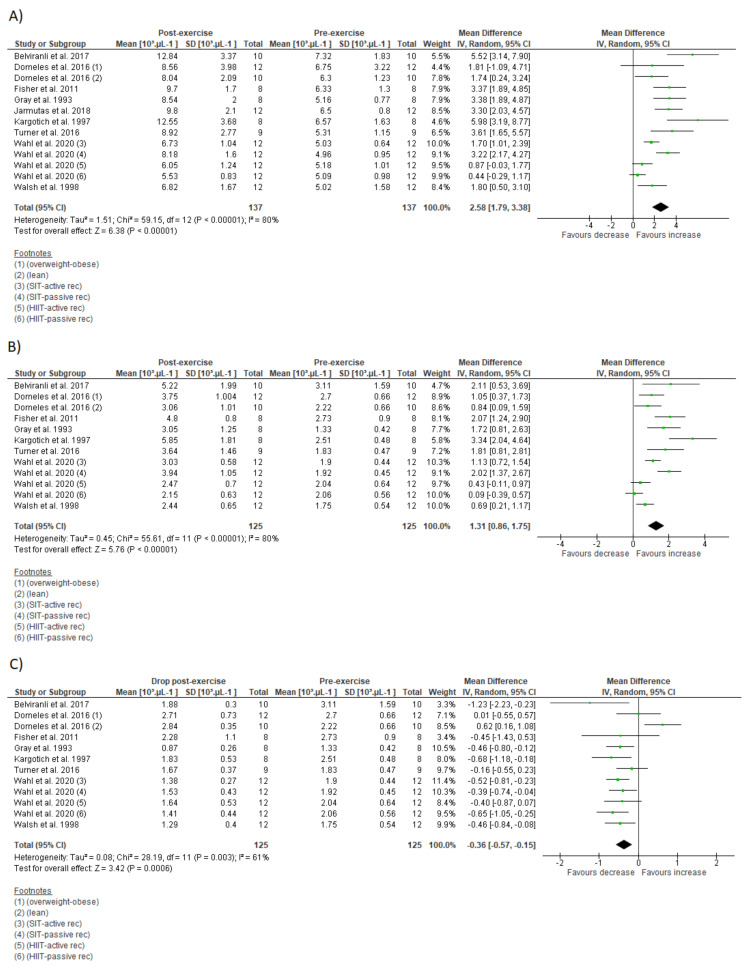
Figure 5.
Forest plot of the acute effects of interval training on total leucocytes count (A), lymphocyte count immediately after exercise (B), and lymphocyte count at first drop during recovery (C). SD standard deviation, CI confidence interval, IV random effects. The green squares represent the mean difference for each dataset. The black diamonds represent the estimated overall effect.

