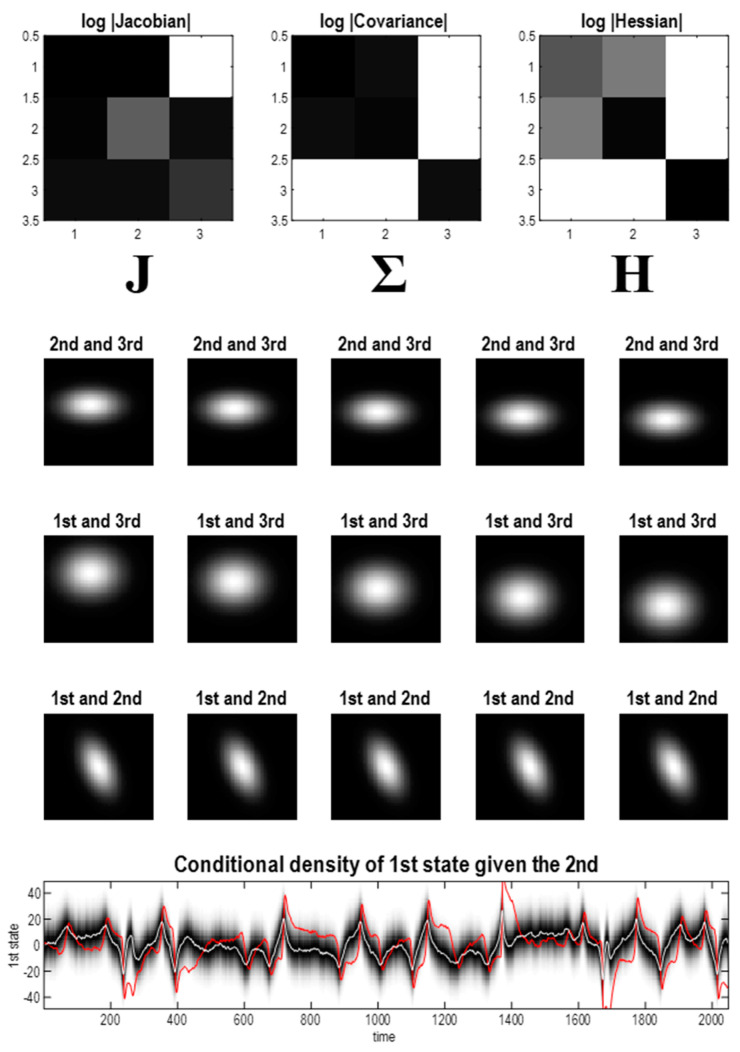
Figure 4.
Nonequilibrium steady-state density. (Upper panel) these images report the constraints on coupling entailed by the Jacobian (left) and manifest in terms of the Hessian (right). The inverse of the Hessian matrix can be read (under the Laplace assumption) as the covariance matrix of the three states. In this example, the third state is independent of the first pair, where this independence rests on the directed coupling from the third to the first state. The matrices correspond to the log of the absolute values of the matrix elements—to disclose their sparsity structure. (Middle panel) these show slices through the ensuing steady-state density over two states, at increasing values of the remaining state. They illustrate the fact that the only correlation in play is between the first and second states. (Lower panel) this correlation is illustrated in terms of the conditional density over the first state, given the second. The shaded areas correspond to the probability density and the white line is the conditional expectation. The red line is the realised trajectory of the first state that is largely confined to the 90% credible intervals. This characterisation uses the trajectory from the stochastic solution shown in Figure 3.

