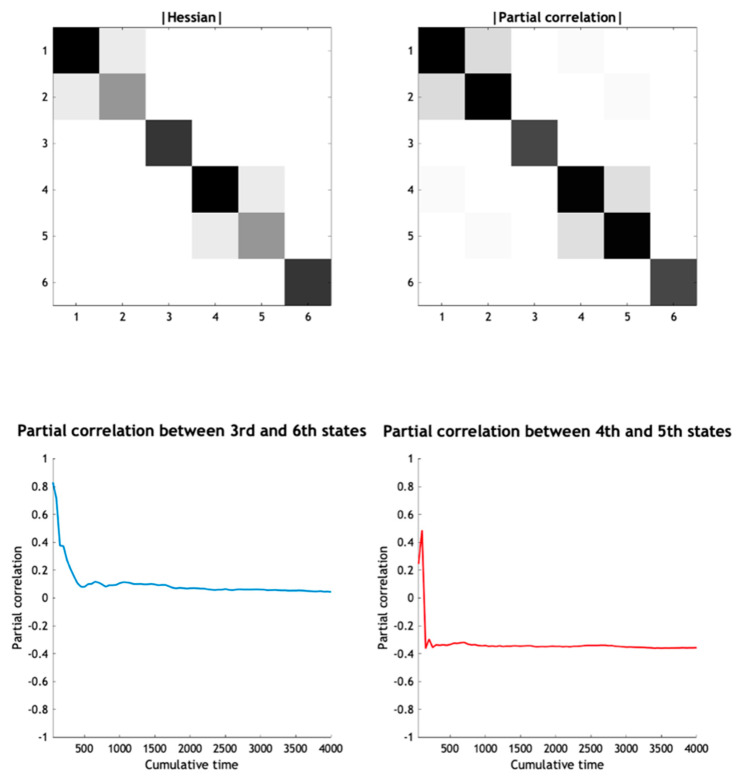
Figure 9.
A numerical analysis of conditional independence. (Upper panel) The partial correlation (right) between each pair of states, regressing out the effect of the remaining states, approximates the Hessian of the (Laplace-approximated) coupled Lorenz system (left). In this figure, the Hessian and the partial correlation are displayed in terms of their norms (i.e., the elements squared). The partial correlation matrix was based on 128 stochastic solutions, each lasting 500 s. The upper right panel shows the average partial correlation matrix based on the entire timeseries and averaged over realisations. (Lower panel) partial correlations are shown for two pairs of states—the 3rd and 6th states (the second dimensions of the respective “internal states” of the first and second Lorenz systems, left side) and the 4th and 5th states (the “sensory state” and first dimension of the “internal state” of the second Lorenz system, right side). The x-axis denotes the increasing length of the timeseries used to evaluate the partial correlations. Note that the 4th and 5th states are not conditionally independent, explaining why the average partial correlation converges to a value around −0.33, whereas the 3rd and 6th states are conditionally independent, given the other states, meaning that the partial correlation converges to 0.

