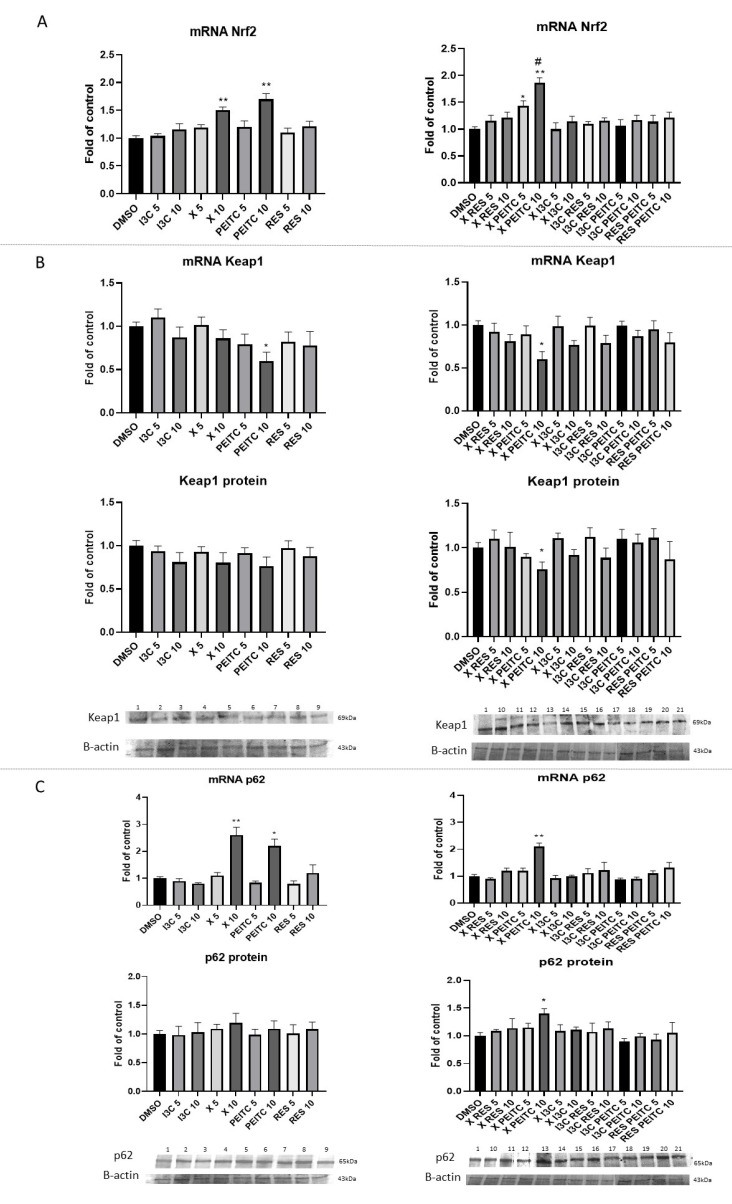
Figure 7.
The impact of X, PEITC, RES, I3C, and their mixtures on the expression of Nrf2, Keap1, and p62 in HepG2 cells. Nrf2 (panel A), Keap1 (panel B), and p62 (panel C) expression was calculated as mRNA level in comparison with control cells. Exemplary immunoblots for the analysis of levels of Keap1 (panel B) and p62 (panel C) protein. Results of the Western blot analysis are estimated as protein level in comparison with vehicle control. The values are shown as the mean ± SEM calculated from three independent experiments (a fold of control) and determined by one-way ANOVA, post-hoc Dunnet test (* p < 0.05; ** p < 0.01). The asterisk (#) above the bar indicates statistically significant differences between X +PEITC and X or PEITC group, p < 0.05 and p < 0.01. Lane 1, cells treated with DMSO; lane 2, I3C 5 µM; lane 3, I3C 10 µM; lane 4, X 5 µM; lane 5, X 10 µM; lane 6, PEITC 5 µM; lane 7, PEITC 10 µM; lane 8, RES 5 µM; lane 9 RES 10 µM; lane 10, X + RES 5 µM; lane 11, X + RES 10 µM; lane 12, X + PEITC 5 µM; lane 13, X + PEITC 10 µM; lane 14, X + I3C 5 µM; lane 15, X + I3C 10 µM; lane 16, I3C + RES 5 µM; lane 17, I3C + RES 10 µM; lane 18, I3C + PEITC 5 µM; lane 19, I3C + PEITC 10 µM; lane 20, RES + PEITC 5 µM; lane 21, RES + PEITC 10 µM.

