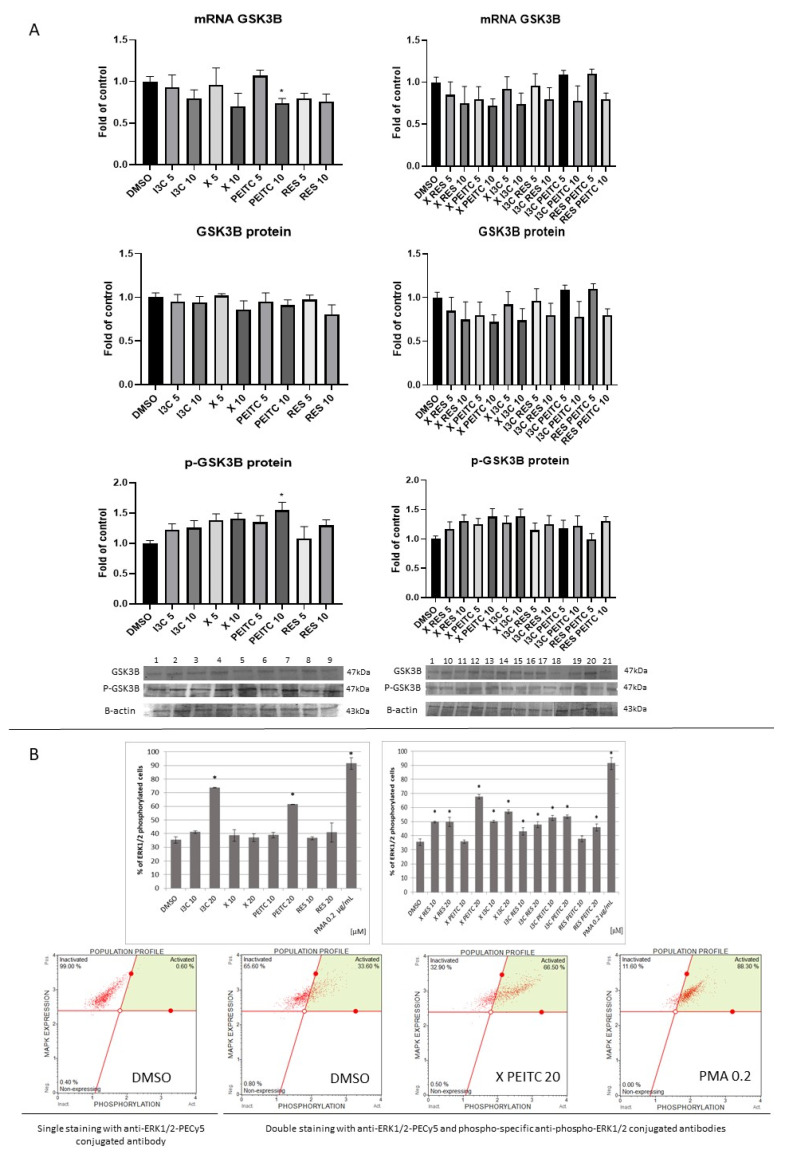
Figure 8.
The impact of X, PEITC, RES, I3C, and their mixtures on GSK-3β expression and phosphorylation and ERK1/2 phosphorylation in HepG2 cells. Panel (A) GSK-3β expression was estimated as mRNA level comparing to control cells (a fold of control). Exemplary immunoblots are presented for GSK-3β and p-GSK-3β protein level. Western blot results are estimated as protein levels comparing to vehicle control (a fold of control). Panel (B) The impact of X, PEITC, RES, I3C, and their equimolar mixtures on ERK1/2 phosphorylation in HepG2 cells. The phosphorylation was measured by the flow cytometric analysis after double staining of cells with anti-ERK1/2-PECy5 and phospho-specific anti-phospho-ERK1/2 conjugated antibodies. PMA (para-methoxyamphetamine) was used as a positive control of ERK1/2 phosphorylation. The values are shown as the mean ± SEM calculated from three independent experiments (a fold of control) and determined by one-way ANOVA, post-hoc Dunnet test (* p < 0.05). Lane 1, cells treated with DMSO; lane 2, I3C 5 µM; lane 3, I3C 10 µM; lane 4, X 5 µM; lane 5, X 10 µM; lane 6, PEITC 5 µM; lane 7, PEITC 10 µM; lane 8, RES 5 µM; lane 9 RES 10 µM; lane 10, X + RES 5 µM; lane 11, X + RES 10 µM; lane 12, X + PEITC 5 µM; lane 13, X + PEITC 10 µM; lane 14, X + I3C 5 µM; lane 15, X + I3C 10 µM; lane 16, I3C + RES 5 µM; lane 17, I3C + RES 10 µM; lane 18, I3C + PEITC 5 µM; lane 19, I3C + PEITC 10 µM; lane 20, RES + PEITC 5 µM; lane 21, RES + PEITC 10 µM.

