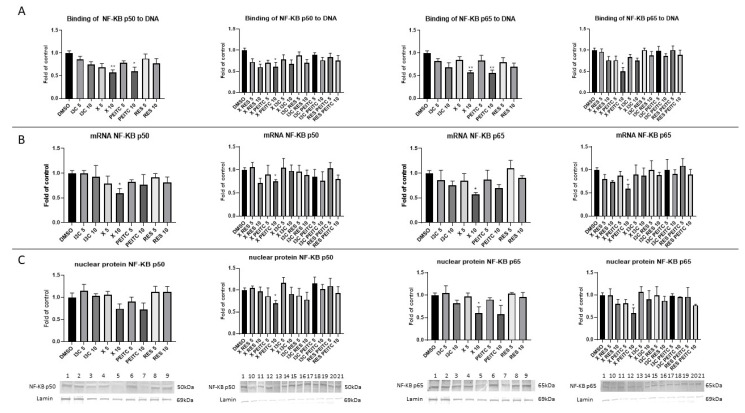
Figure 9.
The impact of X, PEITC, RES, I3C, and their mixtures on NF-κB activation and expression of its active subunits in HepG2 cells. Panel (A) The activation of NF-κB p50 and p65 subunits was assessed in terms of the amount of NF-κB contained in the DNA-binding complexes extracted from the nuclear fraction. Panel (B) NF-κB p50 and p65 expression was calculated as mRNA level in comparison with vehicle control. Panel (C) Exemplary immunoblots are presented for the analysis of the NF-κB p50 and p65 protein levels. The values are shown as the mean ± SEM calculated from three independent experiments (a fold of control) and determined by one-way ANOVA, post-hoc Dunnet test (* p < 0.05; ** p < 0.01). Lane 1, cells treated with DMSO; lane 2, I3C 5 µM; lane 3, I3C 10 µM; lane 4, X 5 µM; lane 5, X 10 µM; lane 6, PEITC 5 µM; lane 7, PEITC 10 µM; lane 8, RES 5 µM; lane 9 RES 10 µM; lane 10, X + RES 5 µM; lane 11, X + RES 10 µM; lane 12, X + PEITC 5 µM; lane 13, X + PEITC 10 µM; lane 14, X + I3C 5 µM; lane 15, X + I3C 10 µM; lane 16, I3C + RES 5 µM; lane 17, I3C + RES 10 µM; lane 18, I3C + PEITC 5 µM; lane 19, I3C + PEITC 10 µM; lane 20, RES + PEITC 5 µM; lane 21, RES + PEITC 10 µM.

