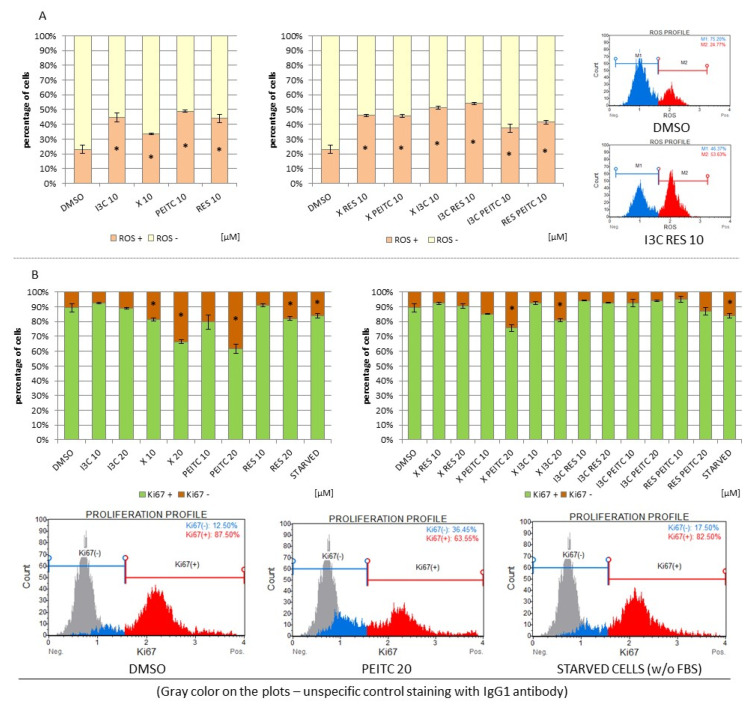
Figure 12.
The impact of X, PEITC, RES, I3C, and their mixtures on the ROS production and on cell proliferation in HepG2 cells. Panel (A) The percentage of reactive oxygen species negative (ROS (−); M1) and positive (ROS (+); M2) cells based on dihydroethidium reaction with superoxide. The fluorescent signal was analyzed by flow cytometry. Exemplary plots are presented on the right side. Panel (B) The percentage of proliferating (Ki67 (+)) and non-proliferating (Ki67 (−)) cells were analyzed by flow cytometry. Starved cells (cultured without FBS) were acted as a reference to antiproliferative conditions. Exemplary plots are presented. Results were calculated from three separate experiments (mean ± SEM). (*) above the bar indicates statistically significant differences from the control group, p < 0.05.

