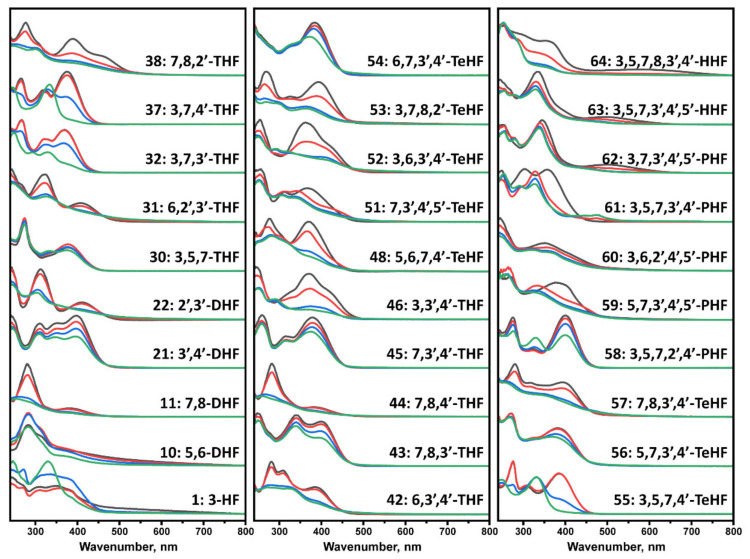
Figure 1.
UV-visible absorbance spectra of flavones, recorded at 0 h (black), 5 h (red), 40 h (blue), and 100 h (green). Spectra were baseline corrected at 800 nm. Most of the flavone spectra experienced a significant change in the 250–450 nm region. In contrast, 21, 30, 43, 45, 54, 56, 60, and 62 experienced only a slight transition of maxima or decrease in the magnitude of the initial absorbance spectrum.

