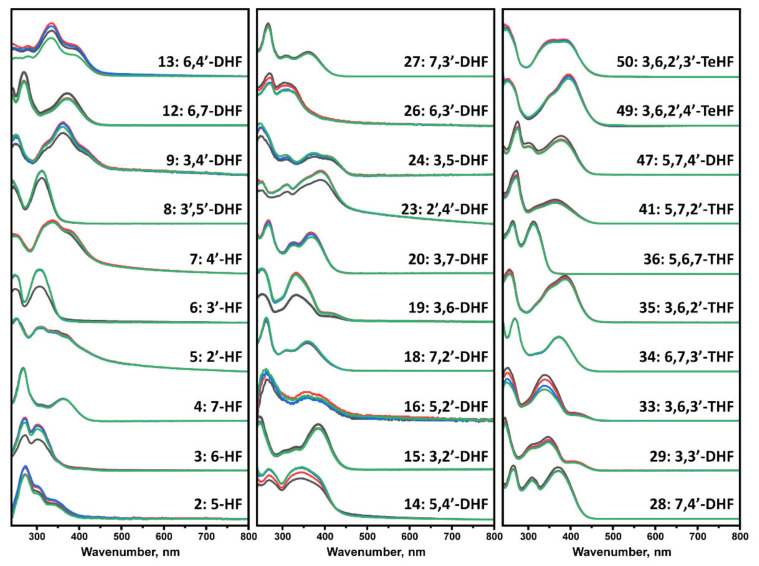
Figure 3.
UV-visible absorbance spectra of flavones, recorded at 0 h (black), 5 h (red), 40 h (blue), and 100 h (green). Spectra were baseline corrected at 800 nm. Numbers 3, 6, 13, 14, 19, 23, 33 experienced the most significant decrease in the magnitude of the spectrum, while 4, 18, 27, 34, 36 had no notable change over the course of the experiment.

