Figure 5.
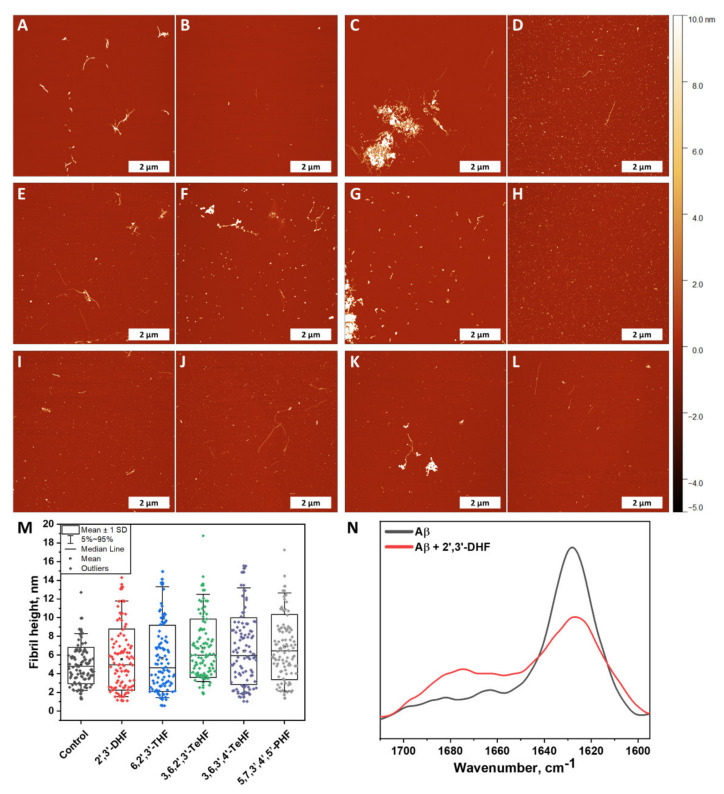
Atomic force microscopy images of Aβ42 formed without (A,B) and with 50 µM of oxidized 2′,3′-DHF (C,D), 6,2′,3′-THF (E,F), 3,6,2′,3′-TeHF (G,H), 3,6,3′,4′-TeHF (I,J) and 5,7,3′,4′,5′-PHF (K,L) flavones. Fibril and oligomeric species height distribution (M), where box plots indicate mean ± SD and error bars are in the 5%–95% range (n = 100). FTIR spectra (N) of Aβ42 fibrils formed alone and with 50 µM of 2′,3′-DHF. The AFM images of Aβ42 aggregates formed with all inhibitors showed a similar distribution in height and revealed round shape structures that were not present in the image of the control sample. The FTIR spectrum of the sample with 2′,3′-DHF had less expressed β-sheet-related band at 1629 cm−1 than the control sample.

