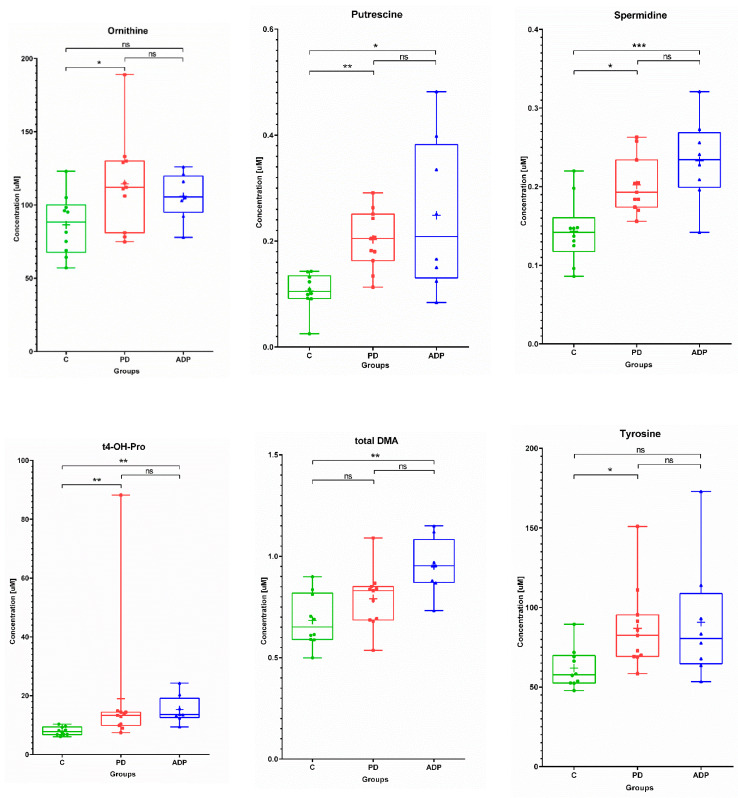
Figure 1.
Box plots showing the distributions of the serum metabolites—amino acids and biogenic amines—found as altered between the studied groups: C—control group, PD—Parkinson’s disease, APDs—atypical parkinsonian disorders. Boxes extend from 25th to 75th percentiles; whiskers denote a range of measured concentrations; line and plus represent the median concentration and the mean of concentration in a group, respectively; dots, squares, and triangles show the measured concentrations in each group. * p ≤ 0.05, ** p ≤ 0.01, and *** p ≤ 0.001; ns—not significant.

