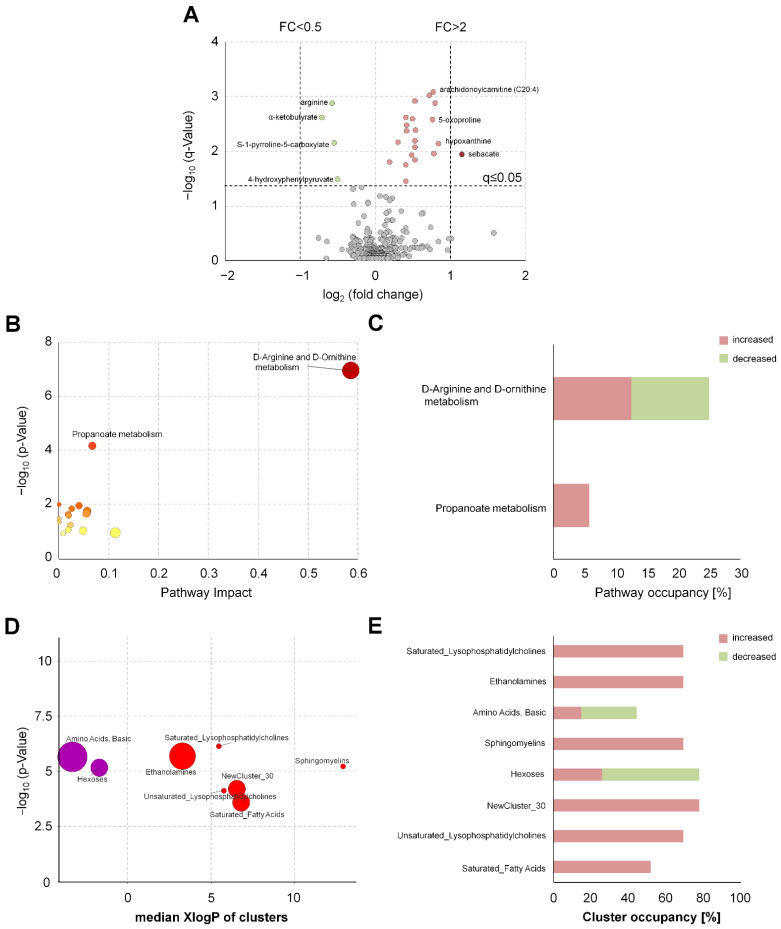
Figure 2.
Chemical similarity and pathway enrichment analysis to identify novel QIs for the precentrifugation delay in human EDTA plasma. (A) Volcano plot of serum metabolites visualizes the effects of prolonged blood incubation after 2 h before centrifugation. Red (increase) and green (decrease) circles indicate altered metabolite levels (discovery sample, n = 10). A paired t-test was performed, and we applied addressed multiple testing by deriving q-values to control the positive false discovery rate. (B) Represents the pathway enrichment analysis using the altered metabolites of (A). Node size represents the impact of the altered metabolites on the pathways and node color visualizes the q-value. (D) ChemRICH set enrichment statistics plot. Each node reflects an altered cluster of metabolites (p-value ≤ 0.05). Node sizes represent the total number of metabolites in each cluster set. Node color scale shows the proportion of increased (red) or decreased (blue) compounds in EDTA plasma samples with a prolonged blood incubation of 2 h compared to the control at 0.5 h. Purple color nodes include both increased and decreased metabolites. (C) The pathway and (E) cluster occupancy visualize the ratio (in %) between increased and decreased metabolites within each altered pathway/cluster of (A).

