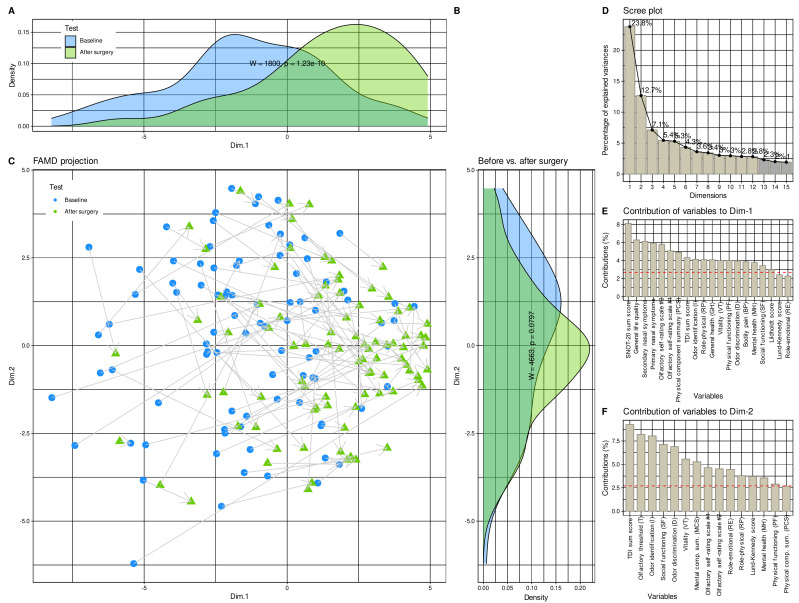
Figure 3.
Results of factor analysis for mixed data (FAMD) of the d = 37 variables acquired before and after the surgery. (A–C) Data structure in the input space of d = 37 variables acquired from the patients before and four months after endoscopic nasal sinus surgery. The data structure has been obtained by means of data projection via FAMD. The plot associated with this analysis shows the sample separation in the first and second dimension of the projection (Dim.1 versus Dim.2). The marginal distribution plots show the segregation of the test occasions along the first principal and second dimensions. The p-values are the results from a Mann–Whitney U-test [56,57]. (D) Bar chart of the fraction of variance explained by the dimensions of the FAMD projection, sorted in descending order of magnitude. (E,F) Barplot of the contribution of parameters to dimensions 1 and 2 of the data projection. The dashed horizontal reference line corresponds to the expected value if the contribution where uniform. House dust, cat, grasses, and early bloomers denote allergy to the respective items. The figure has been created using the R software package (version 4.1 for Linux; https://CRAN.R-project.org/ (accessed on 16 September 2021) [47]) and the R packages “ggplot2” (https://cran.r-project.org/package=ggplot2 (accessed on 16 September 2021) [96]) and “FactoMineR” (https://cran.r-project.org/package=FactoMineR (accessed on 16 September 2021) [68]).

