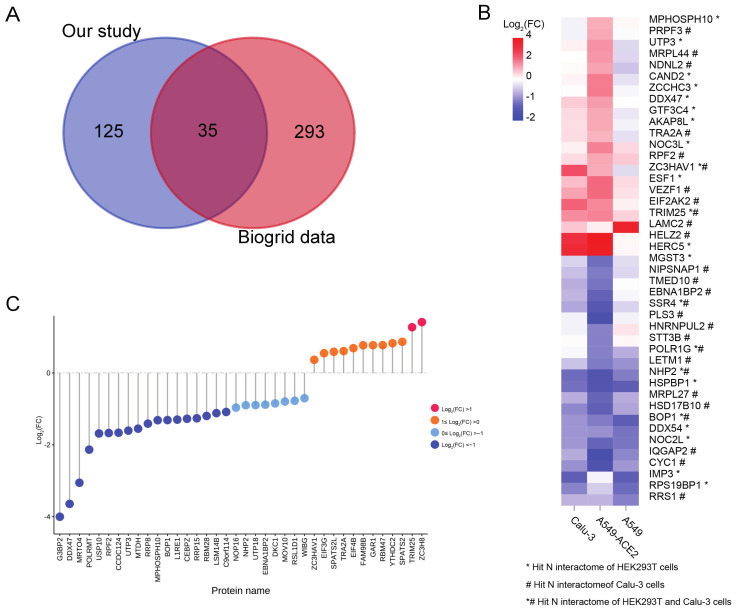
Figure 4.
Overlapping information between the N protein interactome and other SARS-CoV-2-induced proteomes and transcriptomes. (A). Venn diagram showing the overlapping N protein interactions between our study and data obtained from the BioGRID [25] database. (B). Heatmap showing the variation in 43 genes overlapping between the N protein interactome of our study and previous SARS-CoV-2 induced transcriptome datasets [31]. (C). Point bar graph showing the expression of overlapped proteins between the N protein interactions and SARS-CoV-2 induced RNA-binding proteome [30]. FC, fold change.

