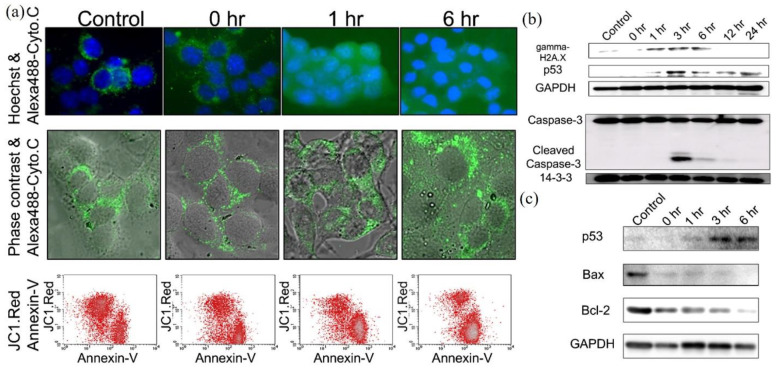
Figure 3.
A typical observation of apoptosis in the CAP-treated melanoma cells B16F10. (a) Cellular images of cytochrome c release by immunocytochemistry and fluorescence-activated cell sorting analysis to check mitochondria membrane potential change. (b) Western blot analysis of the phosphorylation on serine 139 on H2AX histone (γ-H2AX), p53, and caspase-3. (c) Western blot analysis of BAX and BCL-2 [18].

