Figure 8.
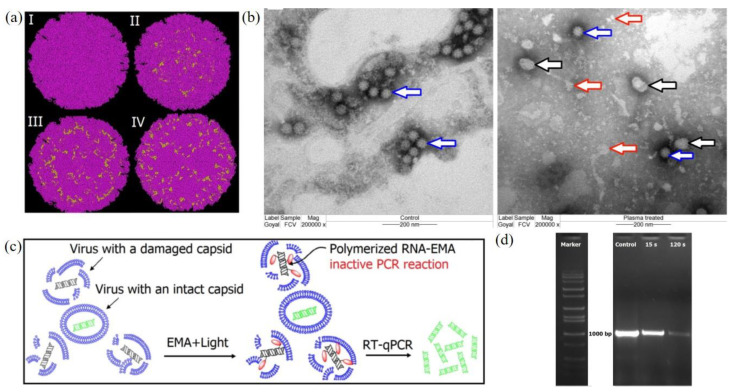
The CAP-triggered damage on FCV. (a) TEM imaging of calicivirus the control (left) and the experimental group (15s, right). Blue arrows, black arrows, and red arrows refer to untreated virus particles, distorted viral particles, and the debris of the damaged viral particles, respectively. (b) The calculated location of oxidized peptide residues (yellow colored) among the N-terminal arm (NTA) domain (I); shell (S) domain (II); P1 subdomain (III); and P2 subdomain (IV). (c) The principles of the quantification of capsid destruction due to CAP treatment. Reverse transcription PCR (RT-PCR) was used to quantify the unaffected calicivirus’s RNA. (d) The agarose gel (DNA) patterns of EMA-coupled RT-PCR products from viral RNA obtained from control, 15 s, and 120 s of CAP treatment [48].

