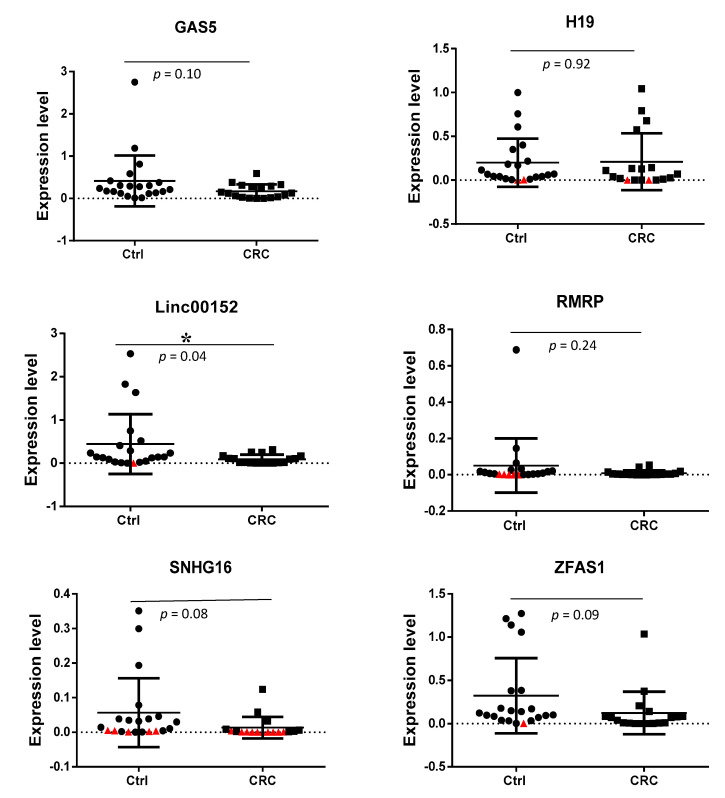
Figure 2.
Comparison of lncRNAs expression level (2(−ΔCt)) in serum exosomes from CRC and non-cancer individuals (Ctrl). The levels of lncRNA expression have been normalized to the reference gene, B2M. The student’s t-test was used to compare the expression of six lncRNAs between non-cancer individuals and CRC patients, * indicates p < 0.05. Samples with Ct value above the cut-off value of 30 were considered as negative expression. Samples that could not be amplified were plotted as red triangles.

