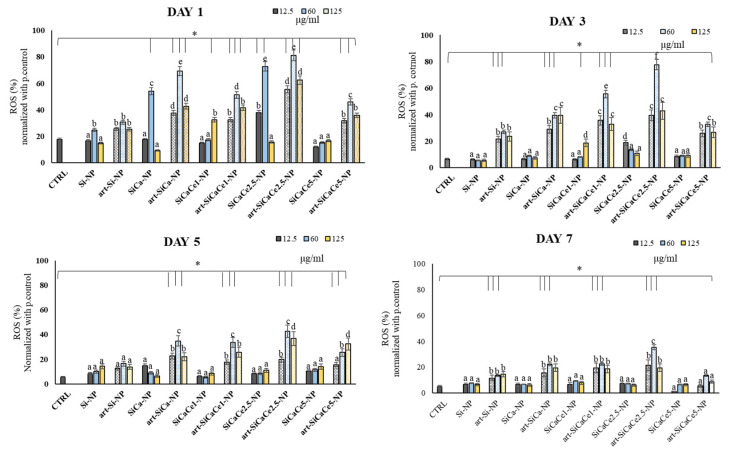
Figure 9.
Extracellular ROS (%) levels after 1, 3, 5 and 7 days of different concentrations (12.5, 60, 125 μg/mL)) of NPs in contact with hPDLFs. The lines with * above bars indicate statistically significant differences (p < 0.05) of ROS % among the treated cells with the different NPs and concentrations and the untreated cells (controls), while different letters above bars suggest statistically significant differences (p < 0.05) of ROS % among the cells treated with different concentrations of NPs. Same letters above the bars suggest that ROS production did not differ significantly among the specific NPs and associated concentrations.

