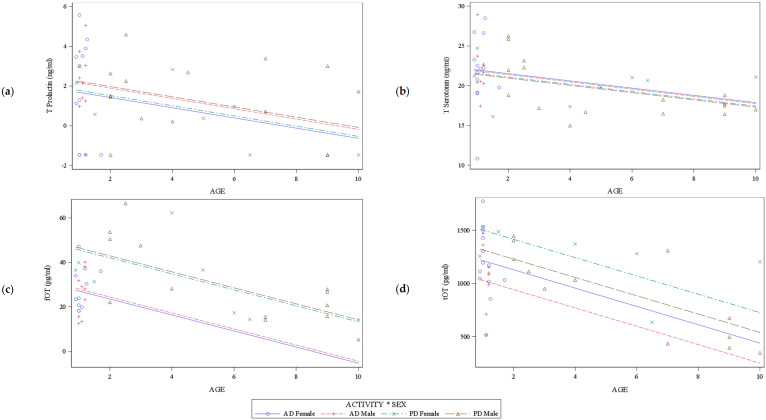
Figure 1.
Linear regression models of T (Transformed) prolactin (a), T (transformed) serotonin (b), free oxytocin (fOT) (c), and total (tOT) (d) according to age, activity, and sex. Individual values are marked with points of different shapes and the regression lines are shown in solid or broken lines of different colors according to the legend. The parallel regression lines highlight that there is no interaction between the factors. Merged or closed regression lines indicate that there is no effect of the factors’ activity/sex, or not much difference between them, respectively. Identical slopes of the regression lines denote similar effects of the age, regardless of the dogs’ activity/sex.

