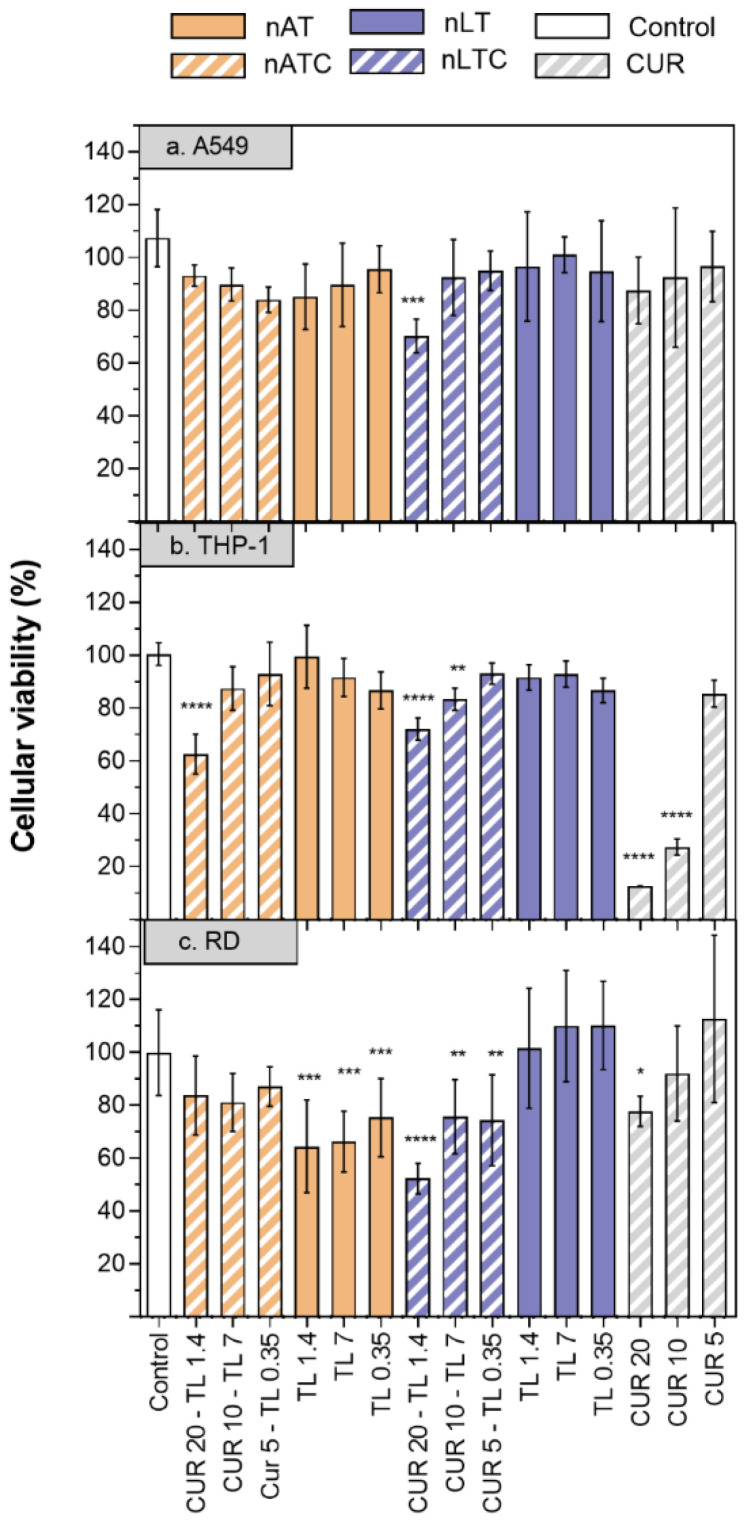
Figure 7.
Cell viability of CUR, nATC, nAT, nLTC, and nLT in A549, THP-1 and RD cell lines. (1) CUR 20 µg/mL—total lipids 1.4 mg/mL, (2) CUR 10 µg/mL—total lipids 0.7 mg/mL, (3) CUR 5 µg/mL—total lipids 0.35 mg/mL. Values were analysed using a one-way ANOVA compared with control, * p < 0.05; ** p < 0.01; *** p < 0.001, **** p < 0.0001.

