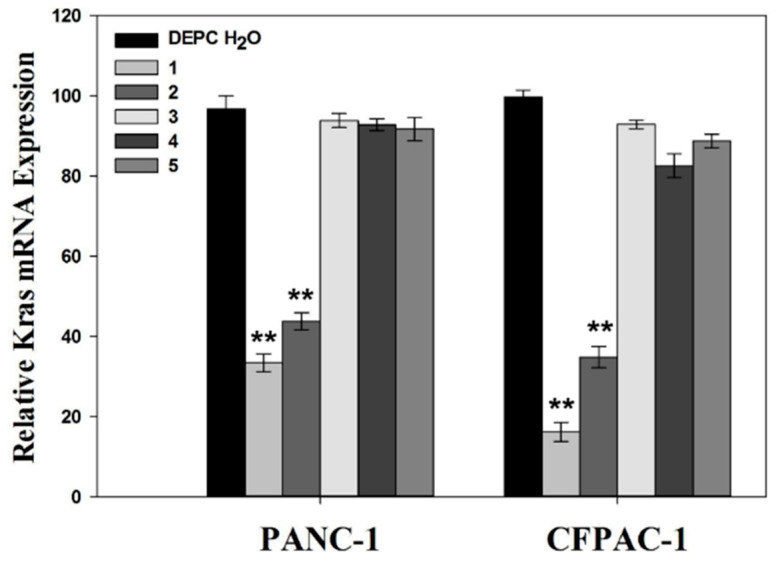
Figure 7.
Expression of Kras mRNA in PANC-1 and CFPAC-1 cells after treatment by (1) siRNA-Mate/siKras, (2) HAp-PEI/siKras, (3) siKras, (4) HAp-PEI, and (5) HAp/siKras for 48 h. DECP H2O was used as control. Values are represented as mean ± SD (n = 3). Statistical significance relative to the group of control: ** p < 0.01.

