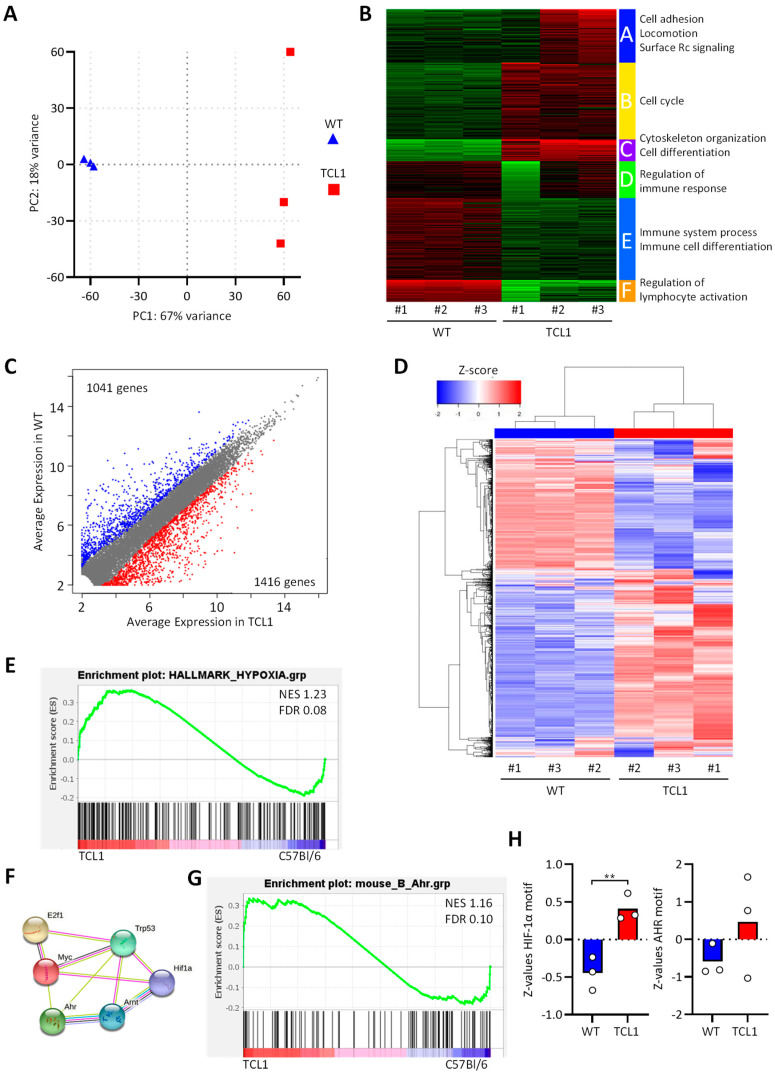
Figure 1.
RNA sequencing of B cells from C57BL/6 and Eµ-TCL1 mice. Splenic B cells were FACS-sorted from three mice of each genotype, and mRNA was sequenced. (A) Principal component analysis of individual animals. (B) K-means clustering and Gene Ontology enrichment analysis. (C) Scatterplot depicting the expression of genes in the groups. (D) Unsupervised hierarchical clustering showing 1416 genes upregulated and 1041 genes downregulated in TCL1. (E,G) Gene Set Enrichment Analysis showing the enrichment of hypoxia (E) and AHR (G) signatures in Eµ-TCL1 versus C57BL/6 mice. (F) Protein–protein interactions network (STRING) for transcription factors involved in enriched hallmark pathways (GSEA). (H) Transcription factor activity (Z-values, ISMARA) for HIF-1α and AHR motifs in WT and TCL1 B cells.

