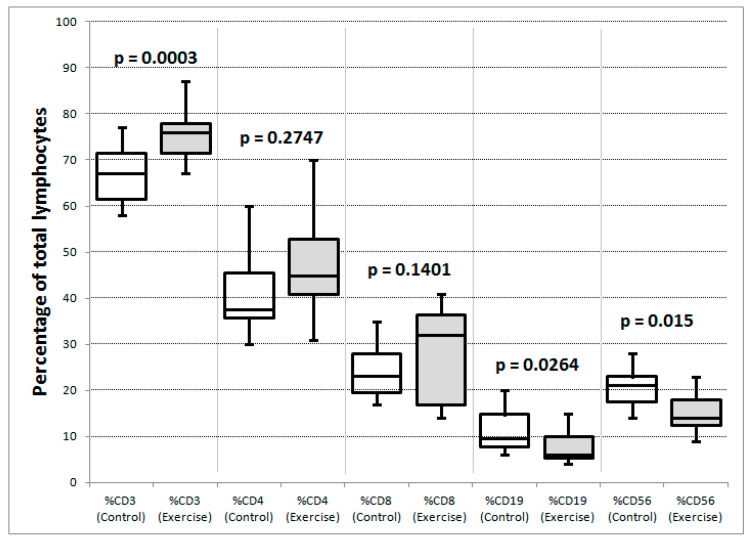
Figure 6.
Comparison of lymphocyte subset percentages between control (white box plots) and exercise groups (shaded box plots). Maximum, minimum, quartiles and median are illustrated for each distribution. The p values are for unpaired t-tests (CD3, CD8, NK-cell) and Mann–Whitney tests (CD4, B-cell) depending on whether the data passed or failed a normality test.

