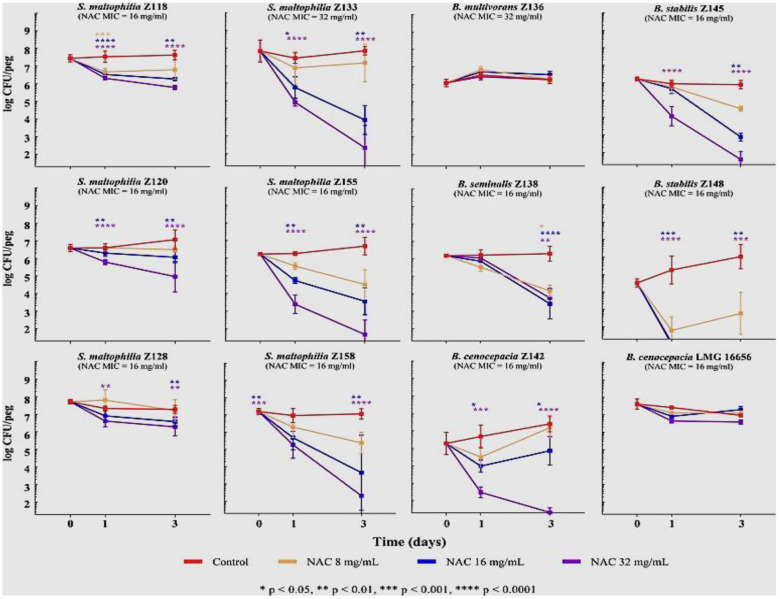
Figure 3.
Time-kill curves of N-acetylcysteine for 2-day-old biofilms of S. maltophilia and BCC. Biofilms were grown on peg lids using the model described by Harrison, J.J. et al. [146]. Data from at least two independent experiments, with at least four replicates per condition per experiment. Median values with standard deviation are plotted. The x axis is set at the limit of detection (i.e., 1.3 log CFU/peg). From Pollini, S. et al., 2018, PLoS ONE 13: e0203941 [144].

