Figure 2.
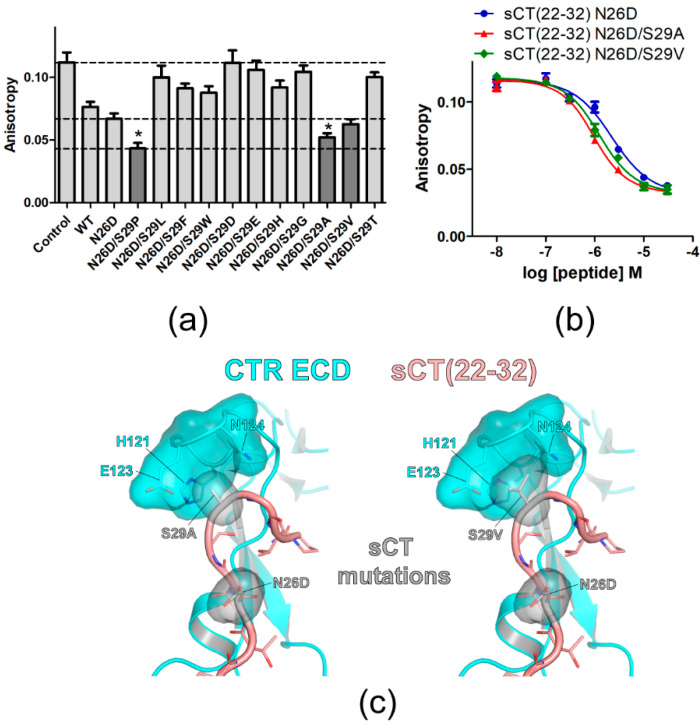
Mutational effects of sCT S29 residue on sCT(22–32) affinity. (a) FP competition peptide binding assay with 3 μM peptide analogs with mutations at S29. The mutations showing lower anisotropy values than that of sCT(22–32) N26D backbone peptide were indicated in dark gray. For comparison, anisotropy values of Control, sCT(22–32) with N26D mutation and sCT(22–32) with N26D/S29P mutations were indicated with dotted lines. Two technical replicates were used for each experiment. Anisotropy values from three independent experiments (each experiment has two technical replicates of anisotropy values for each peptide) were combined and the average anisotropy was shown with S.D. as error bars. Asterisk (*) indicates anisotropy decreases with a statistical significance (p < 0.05) compared to sCT(22–32) N26D. ANOVA with Dunnett’s post hoc test was performed with PRISM. sCT(22–32) N26D was used as a control group for the post hoc test. (b) FP competition peptide binding assay with sCT(22–32) N26D/S29A and N26D/S29V mutations. FITC-sCT(22–32) was used as a peptide probe. Representative peptide-binding curves were shown from three independent experiments. (c) Hypothetical structures of the CTR ECD (PDB 6PFO, Mol A) with sCT(22–32) with N26D/S29A (left) and N26D/S29V (right) mutations. CTR ECD H121, E123, and N124 and sCT N26D, S29A, and S29V mutated residues were shown both with stick and surface representations.

