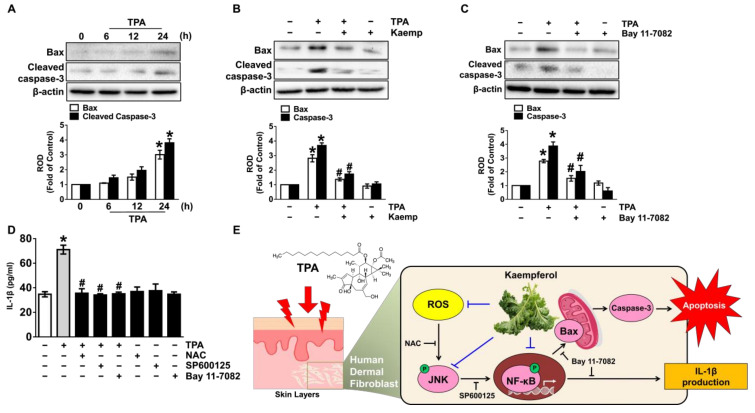
Figure 5.
Kaempferol blocks dermal fibroblastic apoptosis and inflammation initiated by TPA. (A) Time response of TPA on the expression Bax and cleaved caspase-3 in NHDF were evaluated. * p ≤ 0.01 vs. 0 min. n = 3. ROD, relative optical density. (B) NHDF was exposed to the kaempferol and TPA for 24 h. * p ≤ 0.001 vs. control. # p ≤ 0.05 vs. TPA alone. n = 3. (C) Cells were treated with Bay11-7082 for 30 min prior to TPA exposure for 24 h. * p ≤ 0.001 versus control. # p ≤ 0.01 vs. TPA alone. n = 3. (D) Cells were treated with N-acetylcysteine (NAC), SP6001125, and Bay11-7082 for 30 min prior to TPA exposure for 24 h. The level of IL-1β production evaluated by ELISA is shown. * p ≤ 0.01 vs. control. # p ≤ 0.05 vs. TPA alone. n = 3. (E) The sequences of presumed signaling pathways regulated by kaempferol are summarized.

