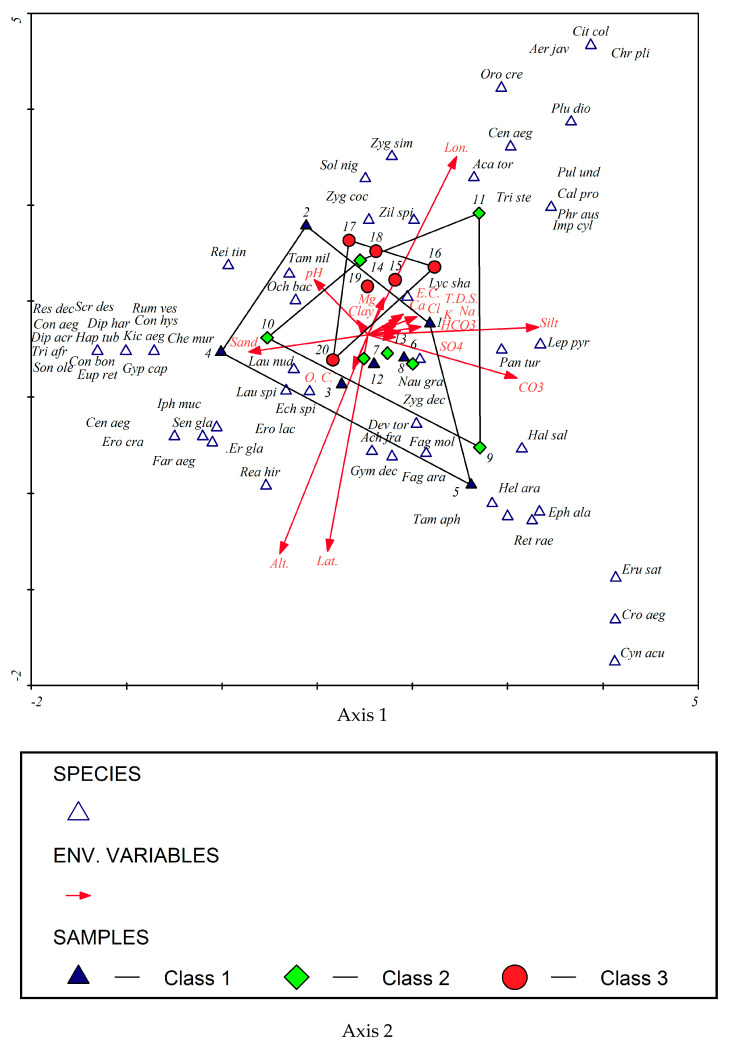
Figure 7.
DCCA triplot showing the distribution of the studied localities and the recorded plant species as well as their relationships to environmental factors. The triangles represent species, and the arrows represent environmental variables. Arrow length expresses relative importance of an environmental variable. Dropping perpendicular to the arrows from each of the “species″ indicates the species′ relative position along the ecological gradient represented by an arrow.

