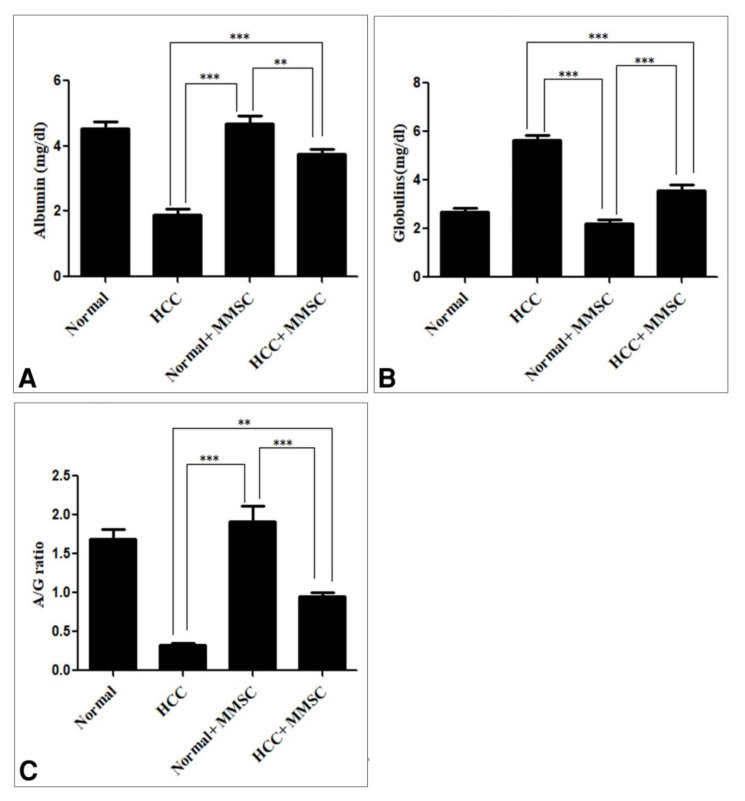
Figure 2.
The serum level of (A) albumin, (B) globulin, and (C) the albumin/globulin (A/G) ratio. Data were presented as mean ± SEM. ** Significantly different at p < 0.001, *** Significantly different at p < 0.0001 using ANOVA followed by Bonferroni’s as a post-hoc test. Hepatocellular carcinoma (HCC), S-methylmethionine sulfonium chloride (MMSC).

