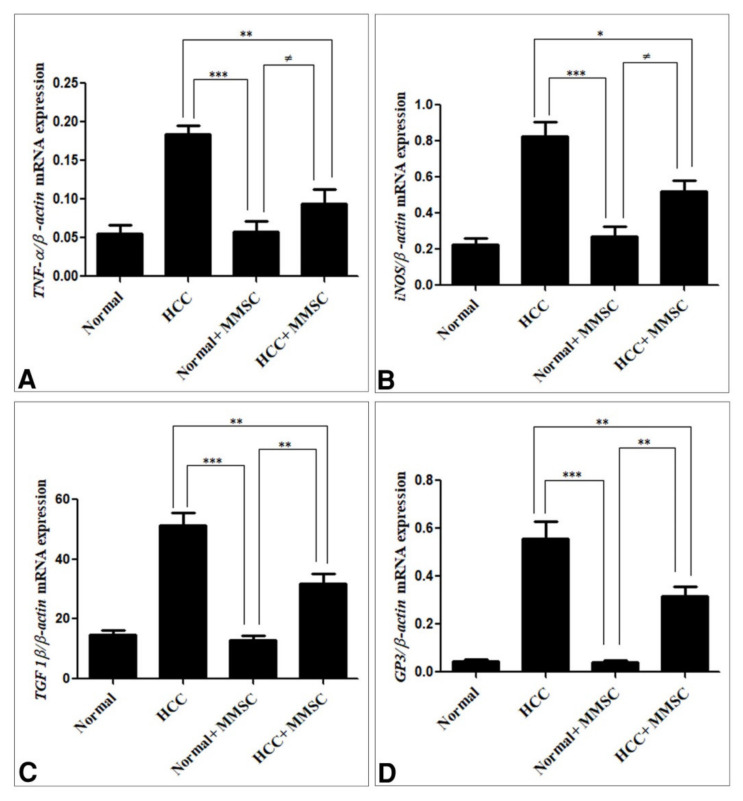
Figure 5.
mRNA expression of genes (A) TNF-α, (B) iNOS, (C) TGF-β1, and (D) GP3 in liver tissues. The mRNA expression levels were measured by qRT-PCR and normalized to β-actin binding protein. The following primer sets were used for the detection (Table 1). Data are the mean ± SEM. * Significantly different at p < 0.05 using ANOVA followed by Bonferroni’s as a post-hoc test, ** Significantly different at p < 0.001, *** Significantly different at p < 0.0001, ≠ no significantly difference using ANOVA followed by Bonferroni’s as a post-hoc test. Hepatocellular carcinoma (HCC), S-methylmethionine sulfonium chloride (MMSC).

