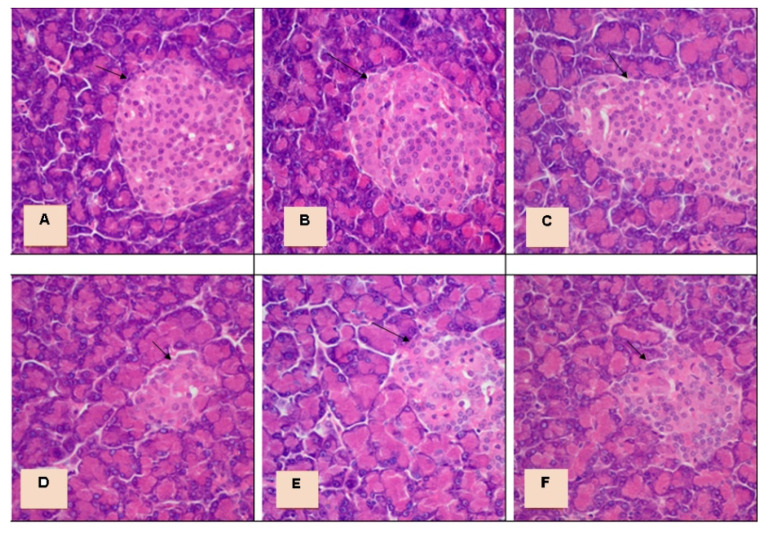
Figure 4.
Morphological structure of the pancreas. The arrows show the islets of Langerhans. ((A)—control (C), (B)—C + G (600 mg/kg), (C)—C + G (1200 mg/kg)—a large number of cells in the pancreatic islets; (D)—diabetes (D)—small islet of Langerhans with signs of discomplexation of secretory cells with vacuolation of the cytoplasm, (E)—D + G (600 mg/kg)—dystrophic changes of the islet of Langerhans, (F)—D + G (1200 mg/kg)—increasing the number of secretory cells, reduced degree of dystrophy). Hematoxylin staining with eosin. Magnification 40 × 10.

