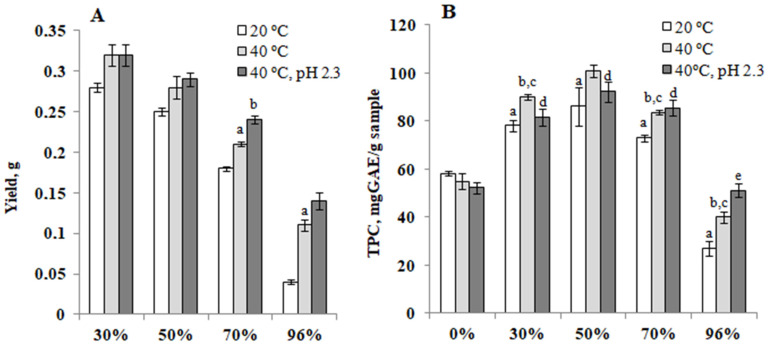
Figure 6.
(A)—The extract yield (g) per 1 g of dry powder of leaves depending on the temperature and pH. a—Significantly different from the water-ethanol extracts, 20 °C (p < 0.05); b—significantly different from the water-ethanol extracts, 40 °C (p < 0.05). (B)—Content of phenolic compounds (mg GAE/g of extract) in water-ethanol extracts of yacon leaves, depending on temperature and pH. a—Significantly different from the 0% ethanol, 20 °C (p < 0.05); b—significantly different from the 0% ethanol, 40 °C (p < 0.05); c—significantly different from the water-ethanol extracts, 20 °C (p < 0.05); d—significantly different from the 0% ethanol, 40 °C (p < 0.05); e—significantly different from the water-ethanol extracts, 40 °C (p < 0.05).

