Figure 1.
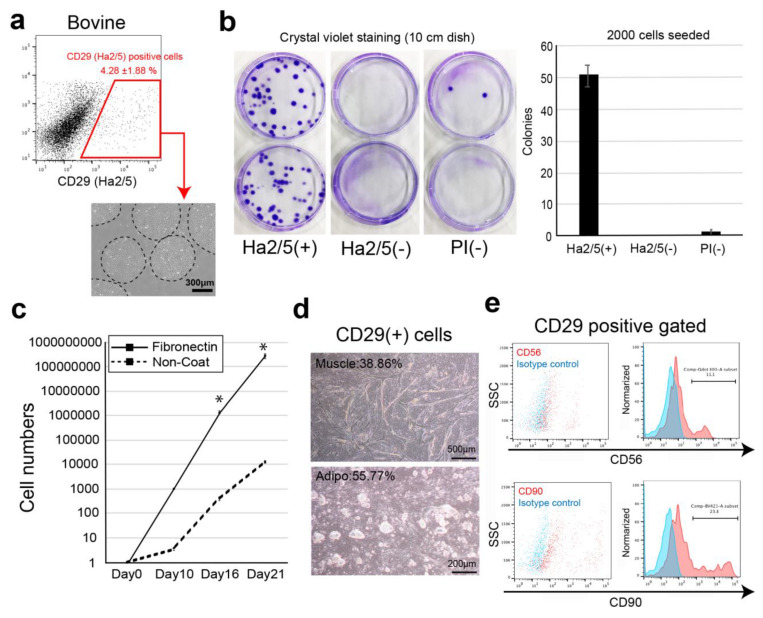
Isolation of colony-forming cells by cell surface markers. (a) Representative flow-cytometric profiles of bovine muscle tissue stained with CD29 (Ha2/5 clone) antibody. Phase-contrast micrographs of Ha2/5 positive cells. Scale bar = 300 μm. (b) Analysis of colony-forming capacity of the Ha2/5+ fraction. Two thousand CD29+, CD29–, and all living cells were sorted and cultured in 10 cm dishes for 14 days. The cells were stained with crystal violet, and the colonies were counted. (c) CD29+ cells were cultured on fibronectin-coated (line) and non-coated (dot-line) culture dishes. The graph shows the cultured cell numbers during 21 days. Results are expressed as mean ± SE (n = 3). * p < 0.05. (d) Differentiation capacity of CD29+ cells. Scale bar = 500 μm. (e) The expression of CD56 and CD90 cell surface markers in CD29 positive fraction (red). Isotype control is used for negative samples (blue).

