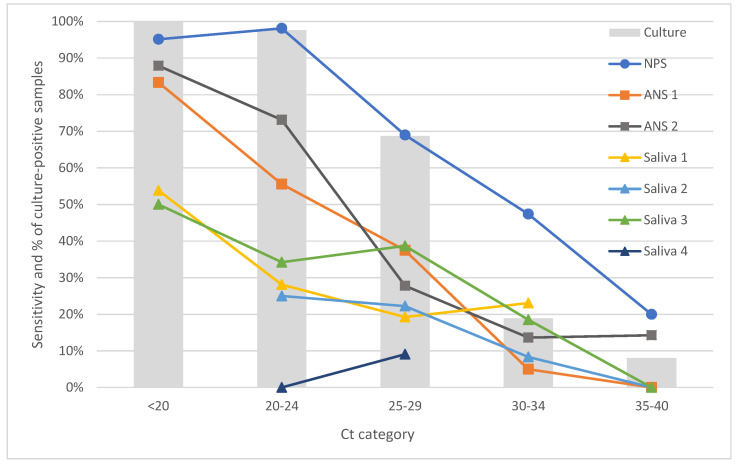
Figure 1.
Sensitivities of individual tests calculated relative to qPCR as the gold standard, and presence of viable virus stratified by Ct cycles; note that cell culture was performed only in 488 samples where qPCR and RAT test results differed; where the respective category included fewer than 5 patients, data are not presented in the graph. NPS–nasopharyngeal swab; ANS–anterior nasal swab; Ct–Cycle threshold.

