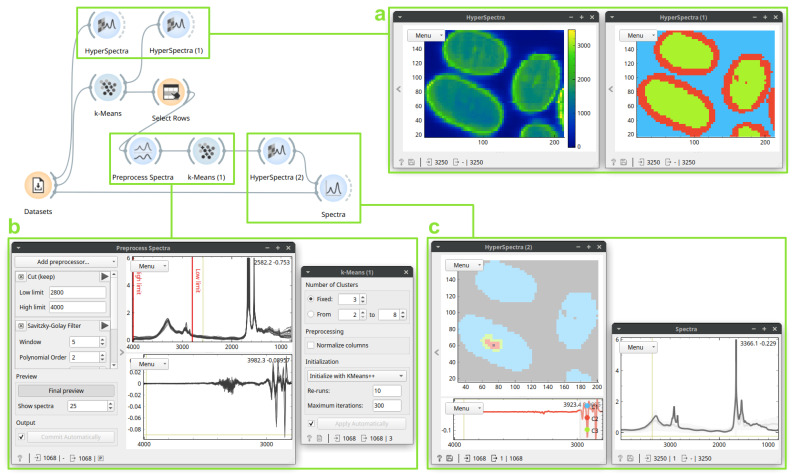
Figure 2.
An unsupervised analysis on a dataset of multiple hair sections. The HyperSpectra (box a, left) displays integrals of the spectral content. The first k-Means clustering outputs three groups of spectra based on their spectral similarity. As these groups correspond to sample morphology well (HyperSpectra, box a, right), selecting (Select Rows) only the innermost removes both the background and the edges (where scattering occurs). After preprocessing (a wavenumber region selection and second derivatives; Preprocess Spectra, box b), k-Means clustering discovers a cluster at the center of the largest cross-section (HyperSpectra, box c, left). A selected spectrum from the cluster in non-derivative space, shown in the Spectra widget (box c, right), contains a lipid signature characterized by peaks between 3000–2800 cm−1.

