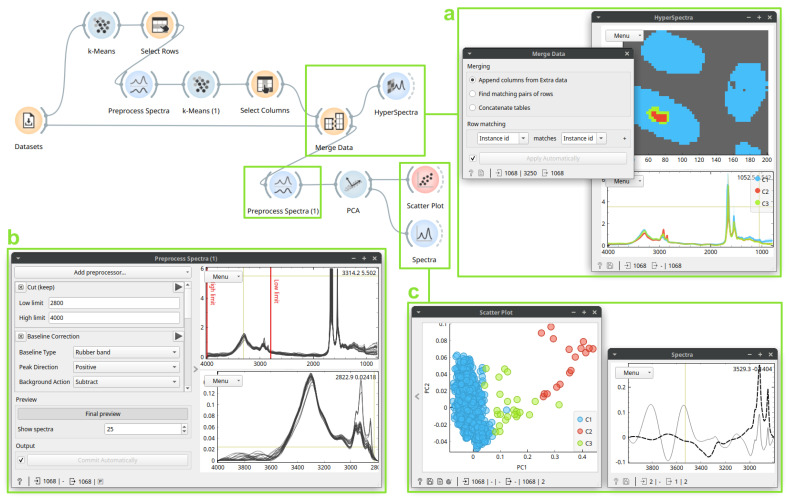
Figure 3.
An unsupervised analysis on a section of multiple hair samples, continued from Figure 2. Here, a Merge Data (box a, left) widget merges the clusters obtained with the previous data for further analysis. The clusters merged with original spectra may be seen in the Hyperspectra widget (box a, right). Here, Preprocess Spectra baseline-corrects and normalizes the data (box b). We then investigate results of the PCA: in the Scatter Plot (box c, left), the red cluster has high PC1 scores, whose loadings, shown in the Spectra (box c, right), contain a characteristic lipid signature between 3000–2800 cm−1.

