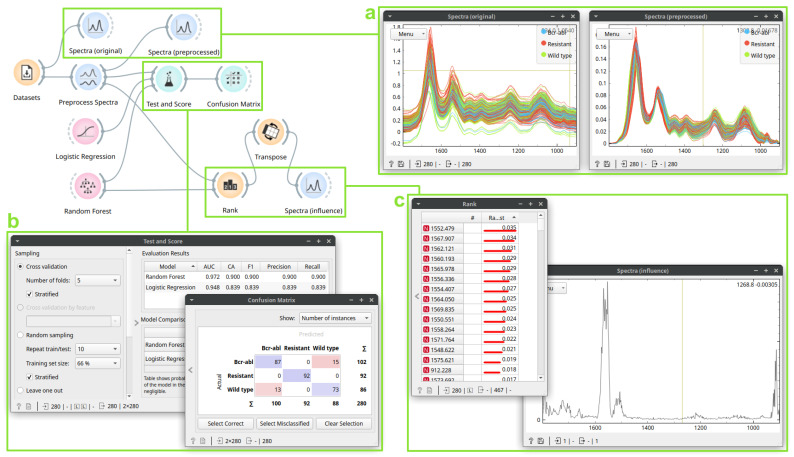
Figure 4.
A workflow for supervised analysis of three cell lines. The first Spectra (box a, left) displays the original data, colored by the cell line. The second Spectra (box a, right) shows data after preprocessing: Preprocess Spectra applies rubber band baseline and vector normalization. The Test and Score (box b, left) widget shows cross-validated prediction quality of two methods: Logistic Regression and Random Forest. The Confusion Matrix (box b, right) widget highlights errors from Random Forests: for the “Resistant” class, there were no errors. Finally, the Rank (box c, left) shows wavenumber importance for the random forest classifier; these are also shown in the Spectra (box c, right) widget: the region 1600–1500 cm−1 is the most important for classification.

