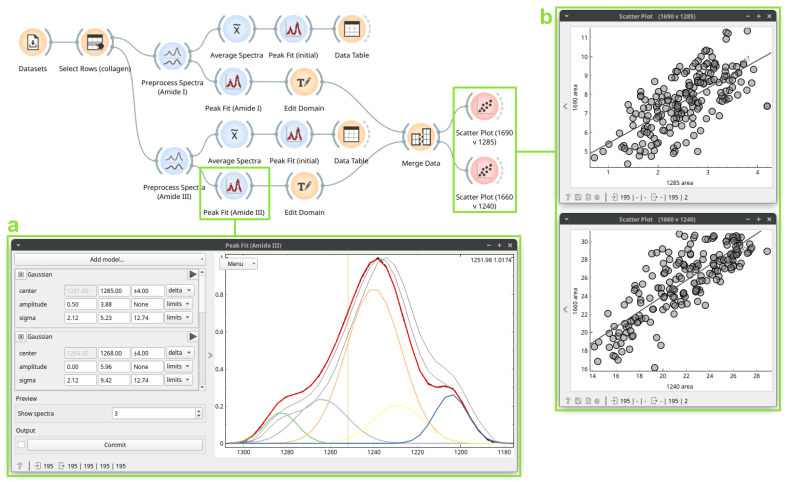
Figure 5.
A workflow for protein secondary structure peak fitting. The Preprocess Spectra cuts the data to the Amide I or Amide III region, applies rubber band baseline and min-max normalization. The Average Spectra computes the average spectrum. The first Peak Fit (initial fits the average spectrum with constraints and default initial values. The second Peak Fit (box a) computes the fit for each spectrum, using initial amplitude and sigma values from the average fit. The Edit Domain labels the peak area features by center wavenumber. The Merge Data combines the Amide I and Amide III peak fit datasets. Finally, the Scatter Plot widgets (box b) show the relationship between selected peak areas for the entire dataset.

