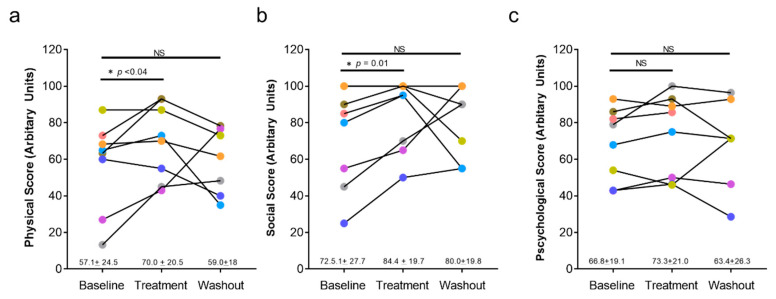
Figure 2.
Effects of QBX258 treatment on quality of life measured using the ULL-27. (a) Quantification of physical score at baseline, following treatment, and following washout period in each patient over time. Average score for the cohort ± SD is shown below the graph. (b) Quantification of social score at each time point for all patients. (c) Quantification of psychological score at each time point for all patients.

