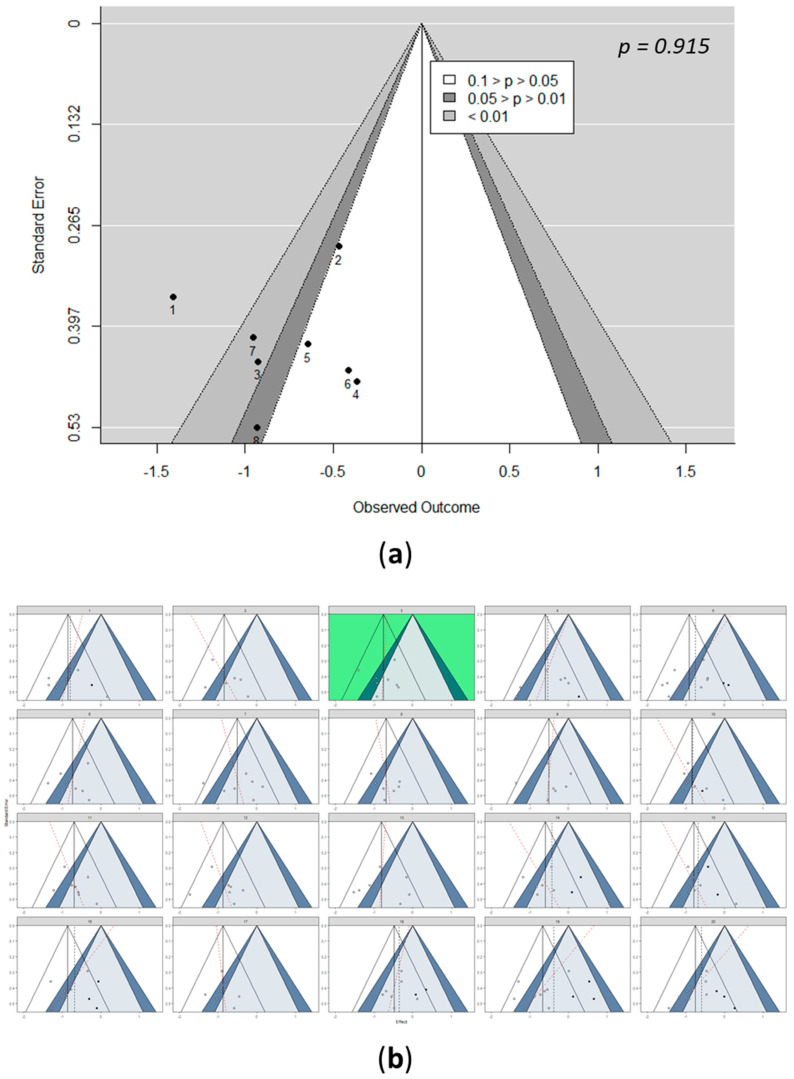
Figure 6.
Detection of bias for IHL. (a) Funnel plot of studies included in the IHL meta-analysis, including 95% confidence contours and significance contours at 0.05 and 0.01 levels, with Egger’s test for the detection of publication bias of included studies in the IHL meta-analysis. (b) Funnel plot line up. One funnel plot shows the actually observed data (green), while the other 19 funnel plots were simulated under the null hypothesis of a fixed-effect meta-analytic model. Shown are 95% confidence contours, the summary effect (vertical line), and significance contours at the 0.05 and 0.01 levels. The black dotted lines and the red lines represent the trim and fill and Egger’s regression, respectively. See Figures S3–S11 in the Supplementary Materials for the detection of bias for all included parameters.

