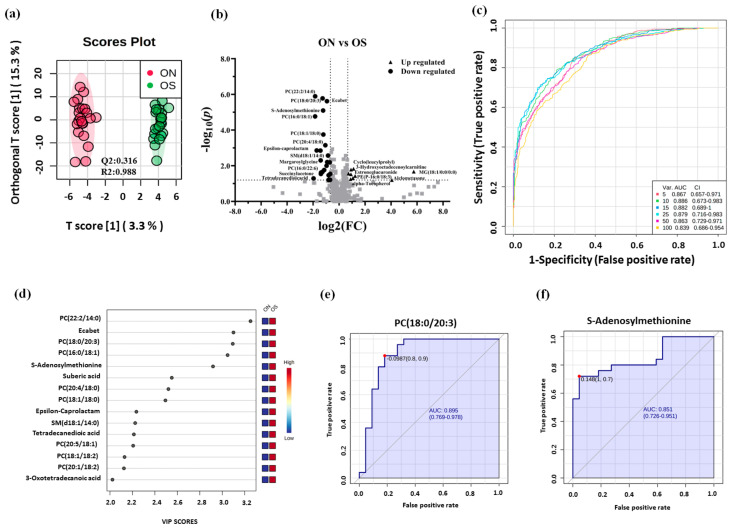
Figure 4.
Metabolomics profiling and biomarker evaluation between ON and OP. (a) An OPLS-DA analysis of the metabolomics profile of ON versus OP groups showing the separation between these two groups (Q2 = 0.316, R2 = 0.988). (b) Volcano plot showing the statistically significant dysregulated metabolites (FDR-corrected p-value < 0.05, and FC >1.5 or <0.67). The levels of 12 metabolites were upregulated, whereas 24 were downregulated in ON compared to the OP group. (c) An exploratory ROC curve was generated by the OPLS-DA model, with AUC values calculated from the combination of five, 10, 15, 25, 50, and 100 proteins. (d) Frequency plot showing 15 positively identified metabolites. (e,f) Representative area under the curve (AUC) for two significantly dysregulated metabolites (S-adenosylmethionine, AUC = 0.851, and phosphatidylcholines PC (18:0/20:3), AUC = 0895).

