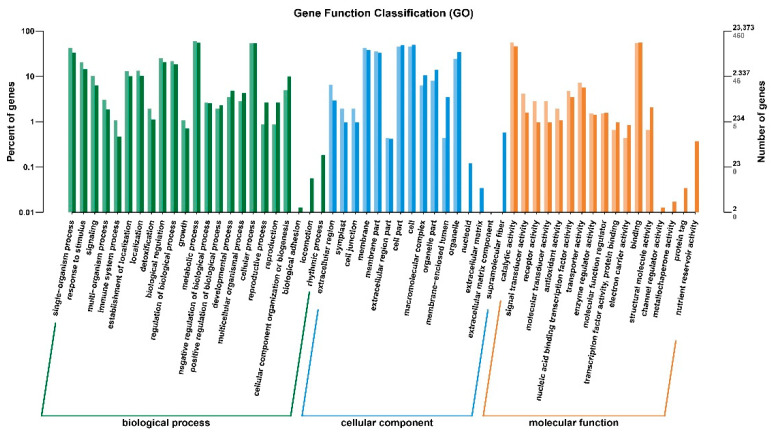
Figure 4.
GO analysis of the functional enrichments of down- and up-regulated DEGs between pl vs. WT at late grain filling stage. Here, horizontal axis represents functional category and vertical axis represents the gene number in the category (right) and the percentage of the total genes on the annotation (left). Various colors signify various categories. Light color on the axis and histogram represents the differentially expressed genes, and dark color represents total number of genes in the respective categories.

