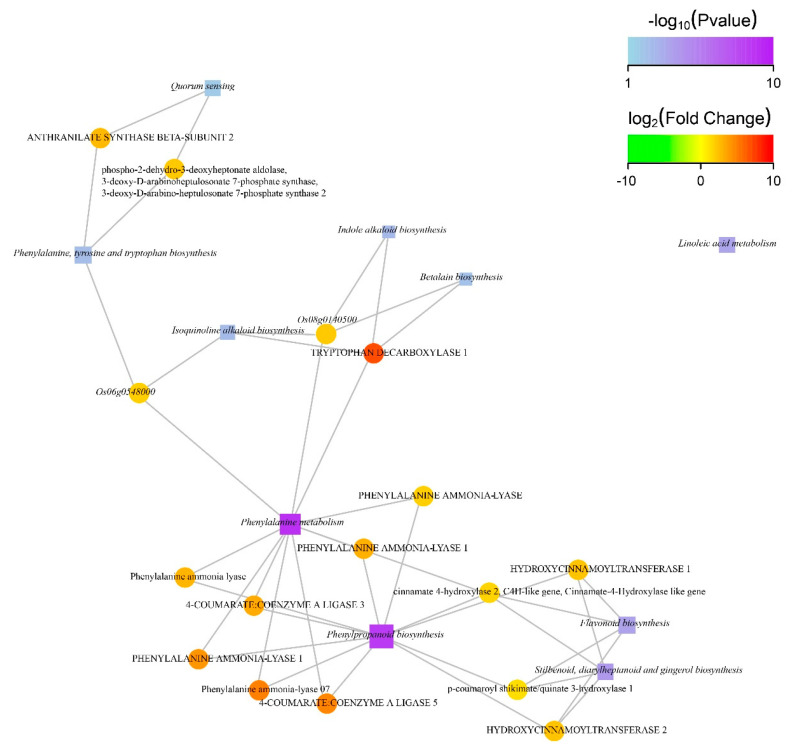
Figure 6.
Significantly enriched functions of gene interaction network in KEGG. Square, circular, and edges nodes represent the function information, genes, and correlation between genes and their functions, respectively. The node size is proportional to the degree of connectivity of the nodes; therefore, more edges are connected to the larger node. The color of the circular node represents degree of difference in gene expression. In the log2FC value, green and red color represent down- and upward adjustment, respectively, and the intensity of color indicates degree of difference between up- and downward adjustments. The color of the square node represents the p value of enrichment program of the function. High enrichment corresponds to low p value with dark color. Square node with comparatively larger area indicates a greater number of DEGs involved in the biological phenomena. DEGs related to this function are drawn by taking only top 10 functions with the highest degree of enrichment.

