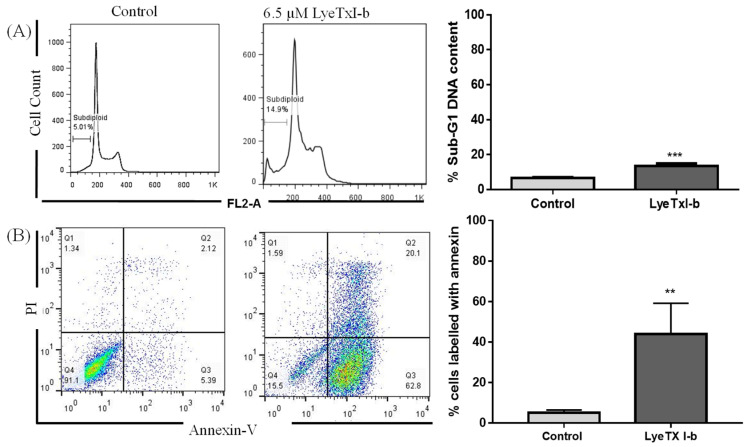
Figure 2.
(A) Representative histograms of cell cycle analysis after exposure to LyeTx I-b and carboplatin at IC50 values for 48 h. The results represent three independent experiments in triplicate and show significant differences between the negative control and the treated cells in terms of the G0/G1 (sub-diploid) population. (B) Illustrative histogram representing the quantification of the proportions of the dead and live cells after exposure of 4T1 cells to 6.5 µM of LyeTx I-b for 24 h and staining with annexin V/Propidium iodide (PI). The number of cells in each quadrant (Q) gate can be quantified as follows: Q4 = live cells (PI negative/annexin V negative); Q3 = apoptotic cells (PI negative/annexin V positive); Q2 = necrotic or late apoptotic cells (PI positive/annexin V positive); and, eventually, Q1 = nuclei without plasma membrane = (PI positive/annexin V negative). Three independent experiments in triplicate and unpaired t-test were performed, ** p < 0.01; *** p < 0.001 compared to the control group.

