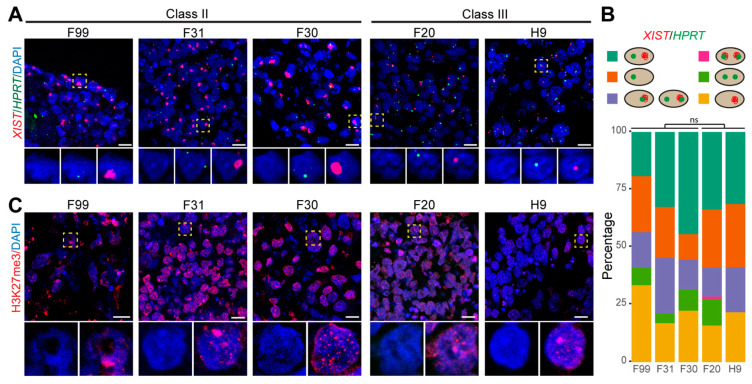
Figure 4.
Expression of XIST, HPRT and H3K27me3 in EBs. (A) RNA-FISH for XIST and HPRT in EBs from female hPSCs. Representative cells indicated by the dashed boxes are shown in zoomed pictures with individual channels displayed separately with DAPI. Scale bars: 10 μm. (B) Quantification of cells regarding the expressions of XIST and HPRT in EBs from female hPSCs (n = 110, 111, 56, 107, 63; for lines F99, F31, F30, F20 and H9, respectively). The cellular patterns of XIST and HPRT expression quantified were cells with non-overlapping HPRT and XIST single dots (XaXi); cells with two overlapping HPRT and XIST dots; cells with two non-overlapping HPRT dots and no XIST (XaXa); cells with one HPRT dot and no XIST; cells with one XIST dot and no HPRT; cells with one overlapping HPRT and XIST dot and or a second non-overlapping HPRT dot. The percentage of cells with non-overlapping XIST single dot (turquoise and yellow group) between Class II and Class III EBs were compared using unpaired Student’s t-test. (C) Immunofluorescence of H3K27me3 in EBs from female hPSCs. Representative cells indicated by the dashed boxes are shown in zoomed pictures of DAPI and DAPI+H3K27me3. Scale bars: 10 μm.

